ESDL MapEditor ESSIM tutorials
This set of tutorials demonstrate how to use the MapEditor to create and configure energy systems and how to run and interpret basic and complex scenarios using ESSIM.
Tutorial 1: Basic Energy System
Description
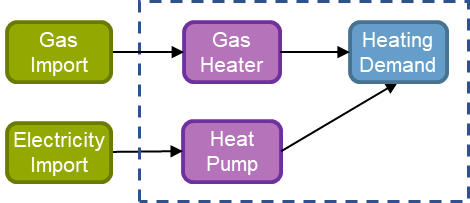
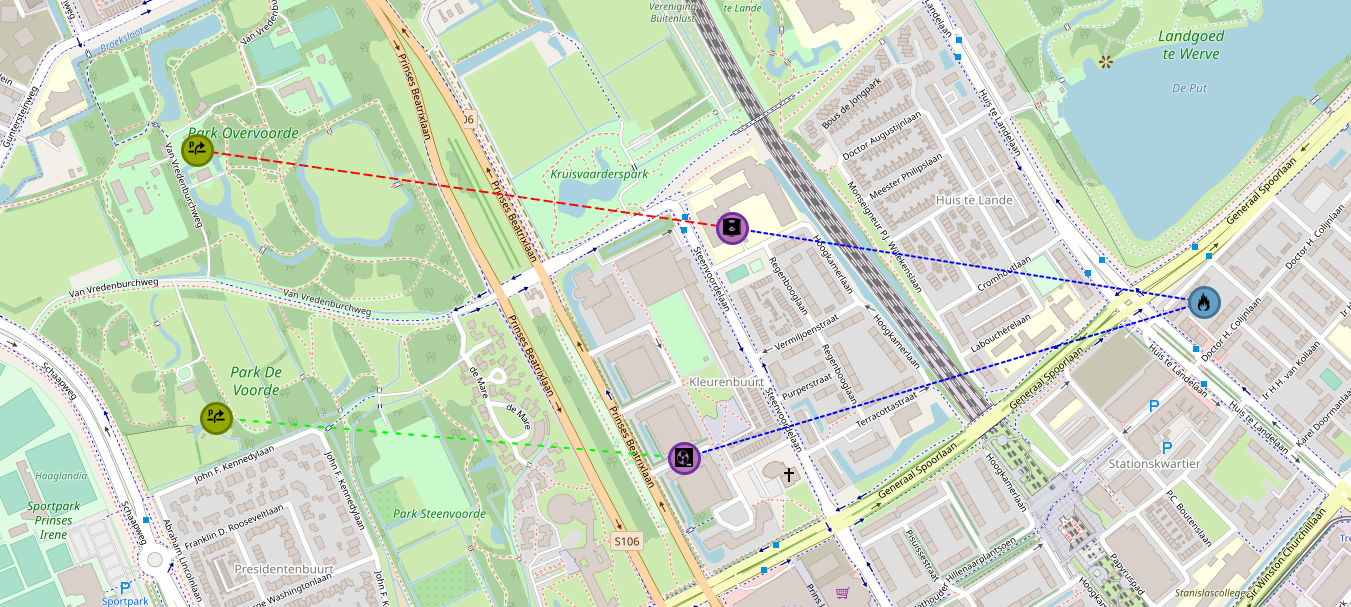
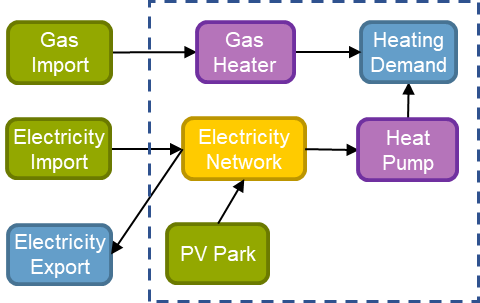
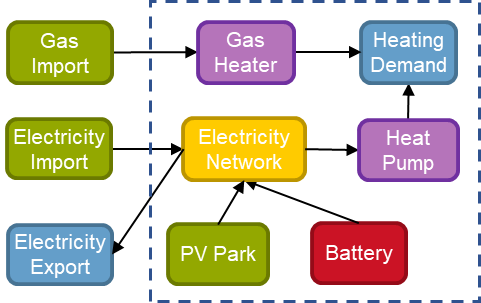
The basic scenario models a simple EnergySystem consisting of a HeatingDemand, a GasHeater and an Import from the backbone gas network.
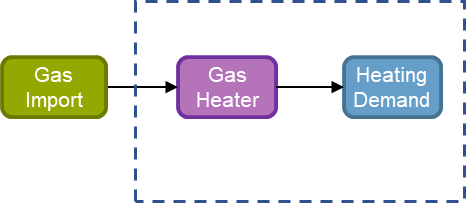
The dashed line indicates the EnergySystem boundaries. In the example above, gas is imported from an external gas source, Import, to the EnergySystem where a conversion, GasHeater, converts this gas to heat and supplies it to meet the HeatingDemand.
Creating an EnergySystem
To create this EnergySystem in MapEditor, start by creating a new ESDL file.
Hover over the *File* dropdown menu and click on *New ESDL*
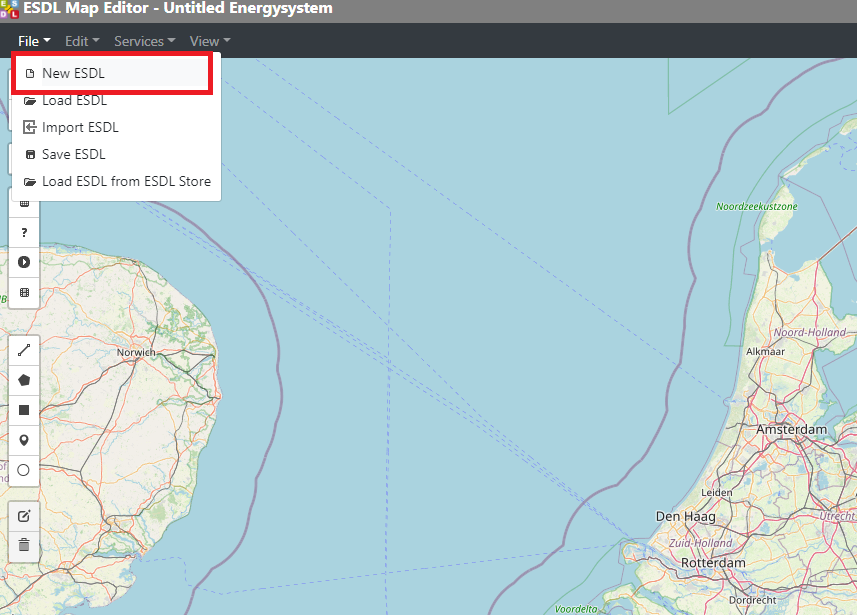
Figure 1: Creating a new ESDL
This opens up a pop-up window, where details such as Name, Description, Email address and Top-level area name can be specified. Enter the desired details as in Figure 2 (1) and click on *Create* (2).
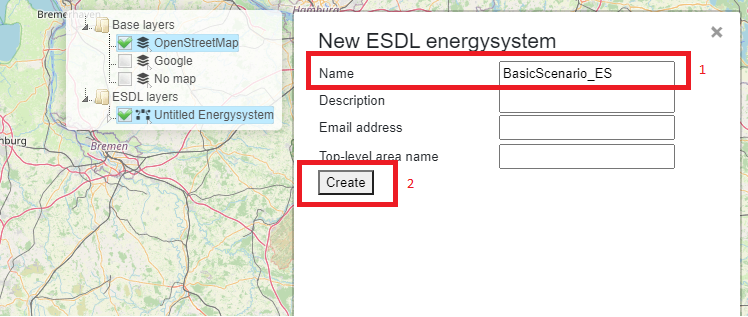
Figure 2: Specifying details of a new EnergySystem
This creates a new, empty EnergySystem, named “BasicScenario_ES”, to which ESDL elements can now be added. The elements can be added anywhere on the map, and specific locations can be found by navigating the map.
The basic EnergySystem in this example consists of three EnergyAssets: HeatingDemand, GasHeater and Import.
To add each of these EnergyAssets, use the first dropdown menu next to *EDR asset* menu item.
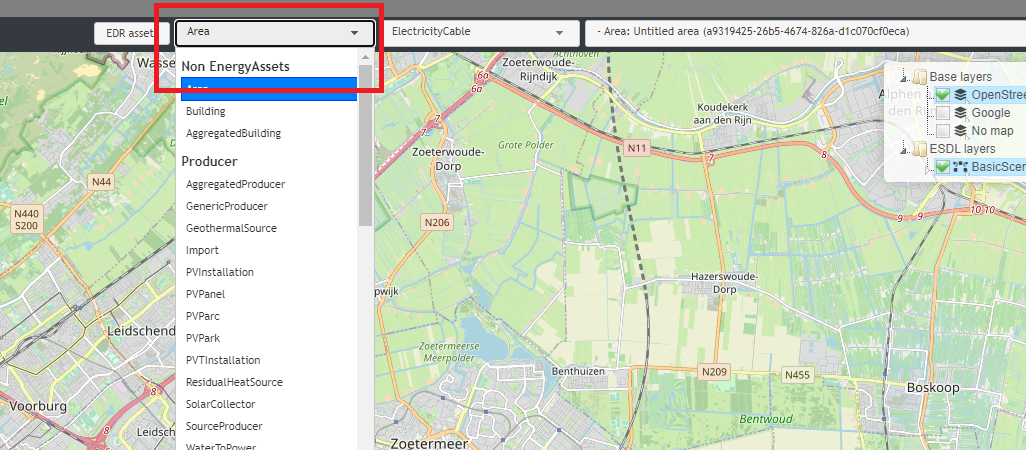
Figure 3: Selecting an EnergyAsset to create
Clicking on the dropdown menu opens a list of Assets to choose from.
Navigate to the HeatingDemand menu item and click on it.
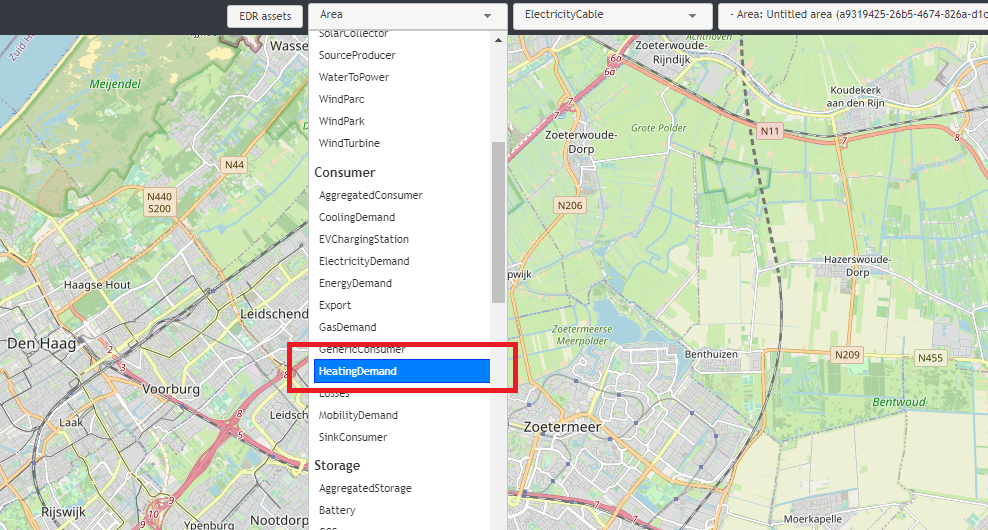
Figure 4: Selecting a new HeatingDemand to create
This creates a HeatingDemand icon next to the mouse cursor that can be placed on the map.
Position the mouse cursor on anywhere on the map and create the EnergyAsset by clicking on the map.
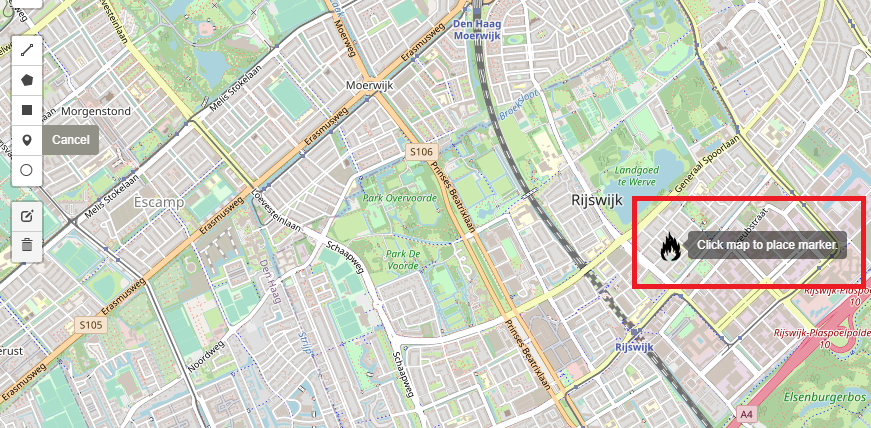
Figure 5: Selecting a location for a new EnergyAsset
This creates a HeatingDemand, indicated by its icon (see the green circle in Figure 6).
Click *Cancel* on the left menu bar (or press the Esc key) to complete the action.
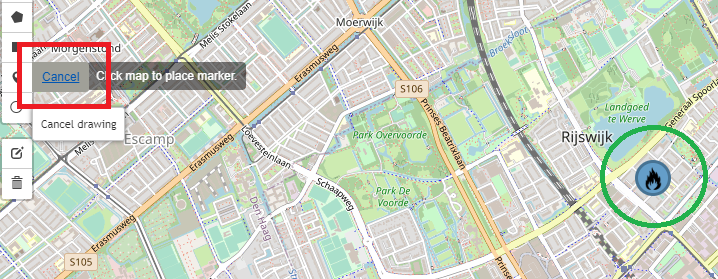
Figure 6: Creating an EnergyAsset on the map
Follow the same steps to create GasHeater and Import. The created energy system show look as that in Figure 7
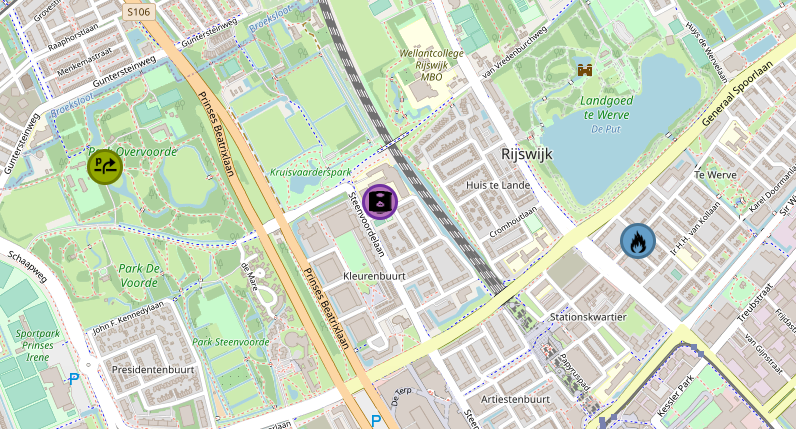
Figure 7: An EnergySystem with Import, GasHeater and HeatingDemand
The next step is to configure the created EnergySystem and its EnergyAssets by adding Carriers and/or Commodities, creating connection between the Assets, configuring the individual Assets by specifying optional and required parameters for an ESSIM simulation (such as, for example, load and production profiles, power etc.). The following subsection demonstrates how to do this.
Configuring an EnergySystem
To run an ESSIM simulation with a created EnergySystem, a number of elements have to be configured. These include:
Connecting Import, GasHeater and HeatingDemand
Adding Gas and Heat energy Commodities and assigning them to Import (Gas) and HeatingDemand (Heat) EnergyAssets
Configuring the necessary parameters of Import, GasHeater and HeatingDemand (e.g. specifying power, efficiency, production type, name etc.)
Setting load profile of HeatingDemand
1. Connecting Import, GasHeater and HeatingDemand
The first step in configuring an EnergySystem is to connect the created EnergyAssets. To connect the Import with GasHeater, follow the steps indicated in Figure 8:
Mouseover the Import icon pops up a red square next to it, indicating an OutPort.
Click on the red square (Indicated as 1 in the left figure) and move the mouse to the GasHeater icon. A dashed line appears following the cursor.
Click on the blue square which appears next to GasHeater (indicating its InPort) (Indicated as 2 in the right picture). Import and GasHeater are now connected.
Repeat the same procedure to connect OutPort of GasHeater (red square) and InPort of HeatingDemand (blue square).
The sequence of these actions determines which EnergyAssets are connected.
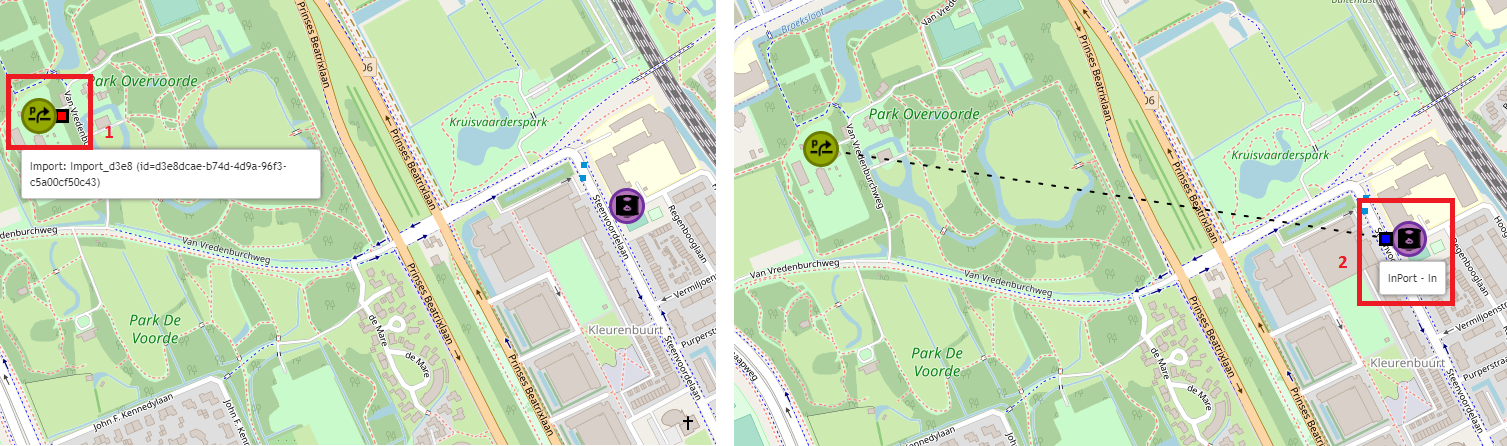
Figure 8: Connecting EnergyAssets
As a check, click on an asset and examine the information below ‘Connections’ in the popup window. For the GasHeater, the InPort should be connected to Import, and theOutPort should be connected to HeatingDemand, as shown in Figure 9. Check the connections of other two EnergyAssets in a similar way.
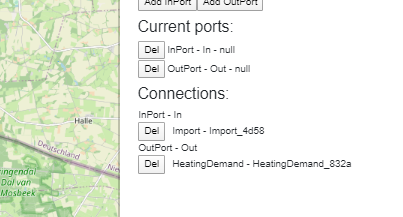
Figure 9: Verifying EnergyAsset connections
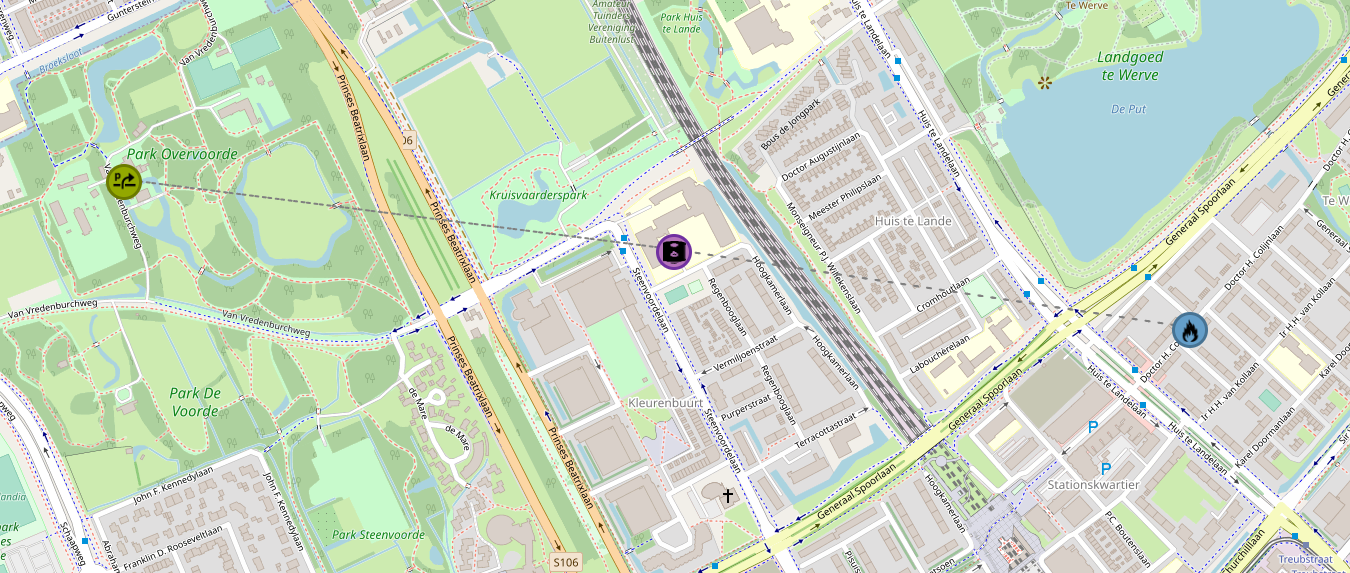
Figure 10: Connected EnergyAssets
2. Adding Gas and Heat energy Commodities and assigning them to Import (Gas) and HeatingDemand (Heat) EnergyAssets
The next step is to add energy Carriers and Commodities. In this basic scenario, two Commodities exist: gas (imported from an external system) and heat (as a result of GasHeater conversion). To add an energy Commodity:
Mouseover the *Edit* menu item and click on *Energy carriers* (see Figure 11).
A pop-up menu opens with a list of energy Carriers and Commodities that can be added and configured.
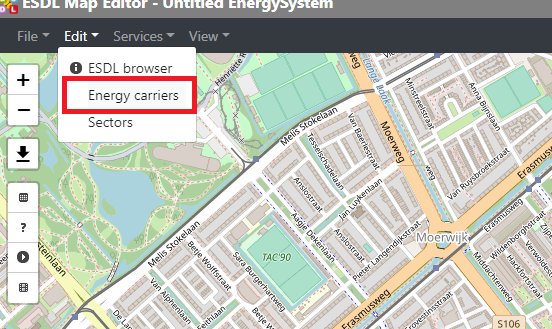
Figure 11: Adding a new Energy Commodity
Click on the dropdown menu, and select Gas commodity.
Give it a descriptive name (1) and leave the other fields blank.
Click on *Add carrier* (2).
Repeat the same process to create a Heat commodity.
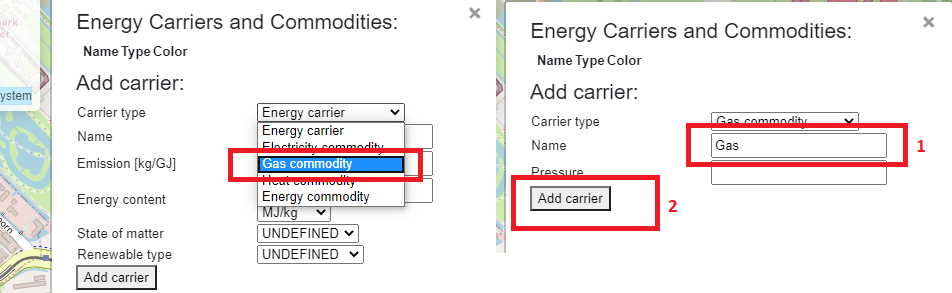
Figure 12: Adding a Gas commodity
3. Configuring the necessary parameters of Import, GasHeater and HeatingDemand (e.g. specifying power, efficiency, production type, name etc.)
After creating energy Commodities, assign energy Commodities to an EnergyAsset by right-clicking on its icon and selecting *Set carrier*. In this basic scenario, energy commodities must be added to Import producer and HeatingDemand consumer. Selecting *Set carrier* opens a pop-up menu with a list of Commodities to select from.
Right click on Import.
Select *Set carrier*.
Choose *Gas commodity*.
The window automatically closes and the Commodity is set for the selected EnergyAsset. Repeat the process for HeatingDemand and select *Heat commodity* from the pop-up menu.
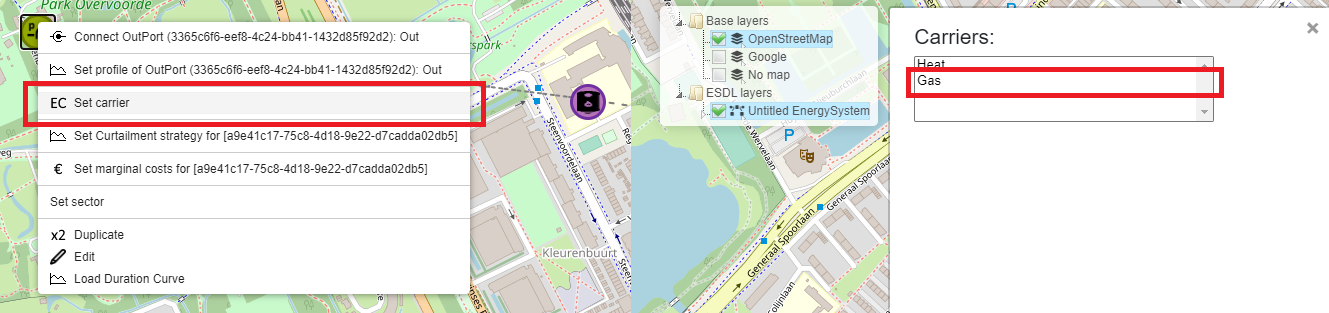
Figure 13: Setting Energy commodities
After refreshing the browser (press F5), connections between EnergyAssets should have different colors indicating different energy Commodities.
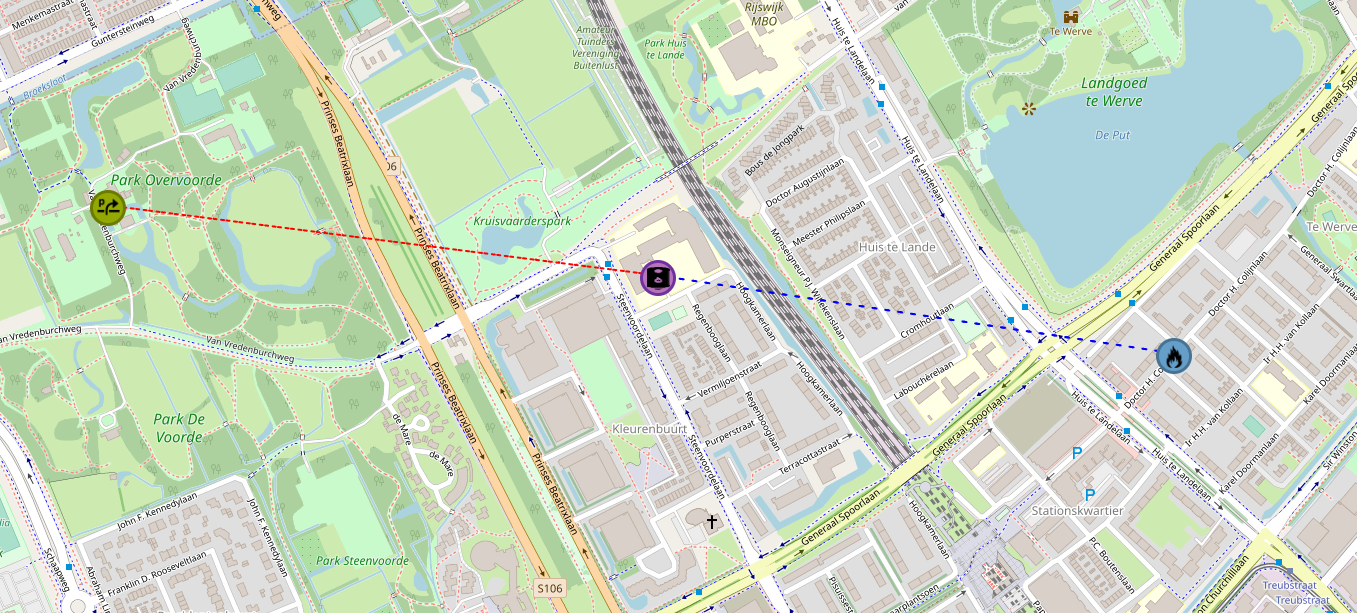
Figure 14: Colors indicating different energy Commodities
4. Configuring the necessary parameters of Import, GasHeater and HeatingDemand
The next step is to configure individual EnergyAssets by specifying required and optional parameters.
Click on the HeatingDemand icon (see Figure 15) (1) . This opens up a pop-up menu with a number of configurable parameters.
In case of HeatingDemand, no parameters have to be changed for an ESSIM simulation.
For the purpose of demonstration, set the name of the HeatingDemand to HeatingDemand_Local (2).
Close the pop-up menu. Parameters changes are automatically saved (3).
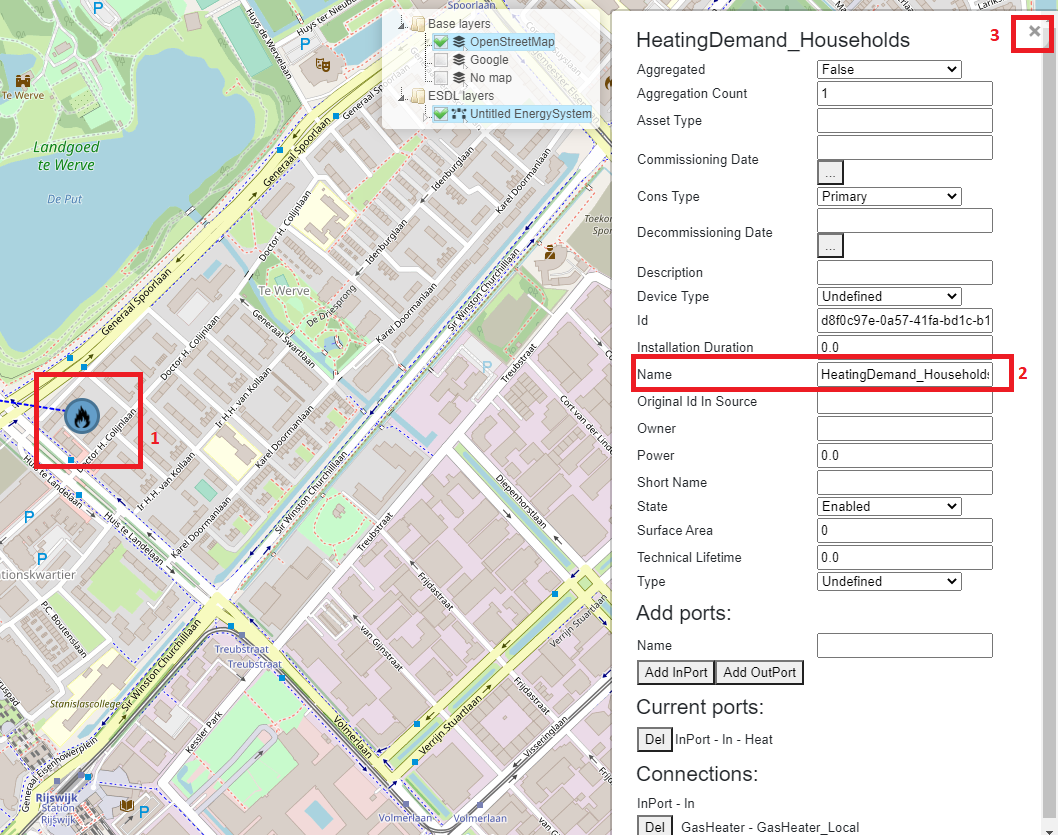
Figure 15: Configuring HeatingDemand
Using a GasHeater in an ESSIM simulation requires specifying efficiency (percentages) and maximum power (in Watts).
Right click on the GasHeater icon to see the pop up window.
Set the efficiency of the GasHeater to 0.9 (90%) (2).
Set the maximum power to 6000 Watts (3) (see Figure 16).
Close the menu (4).
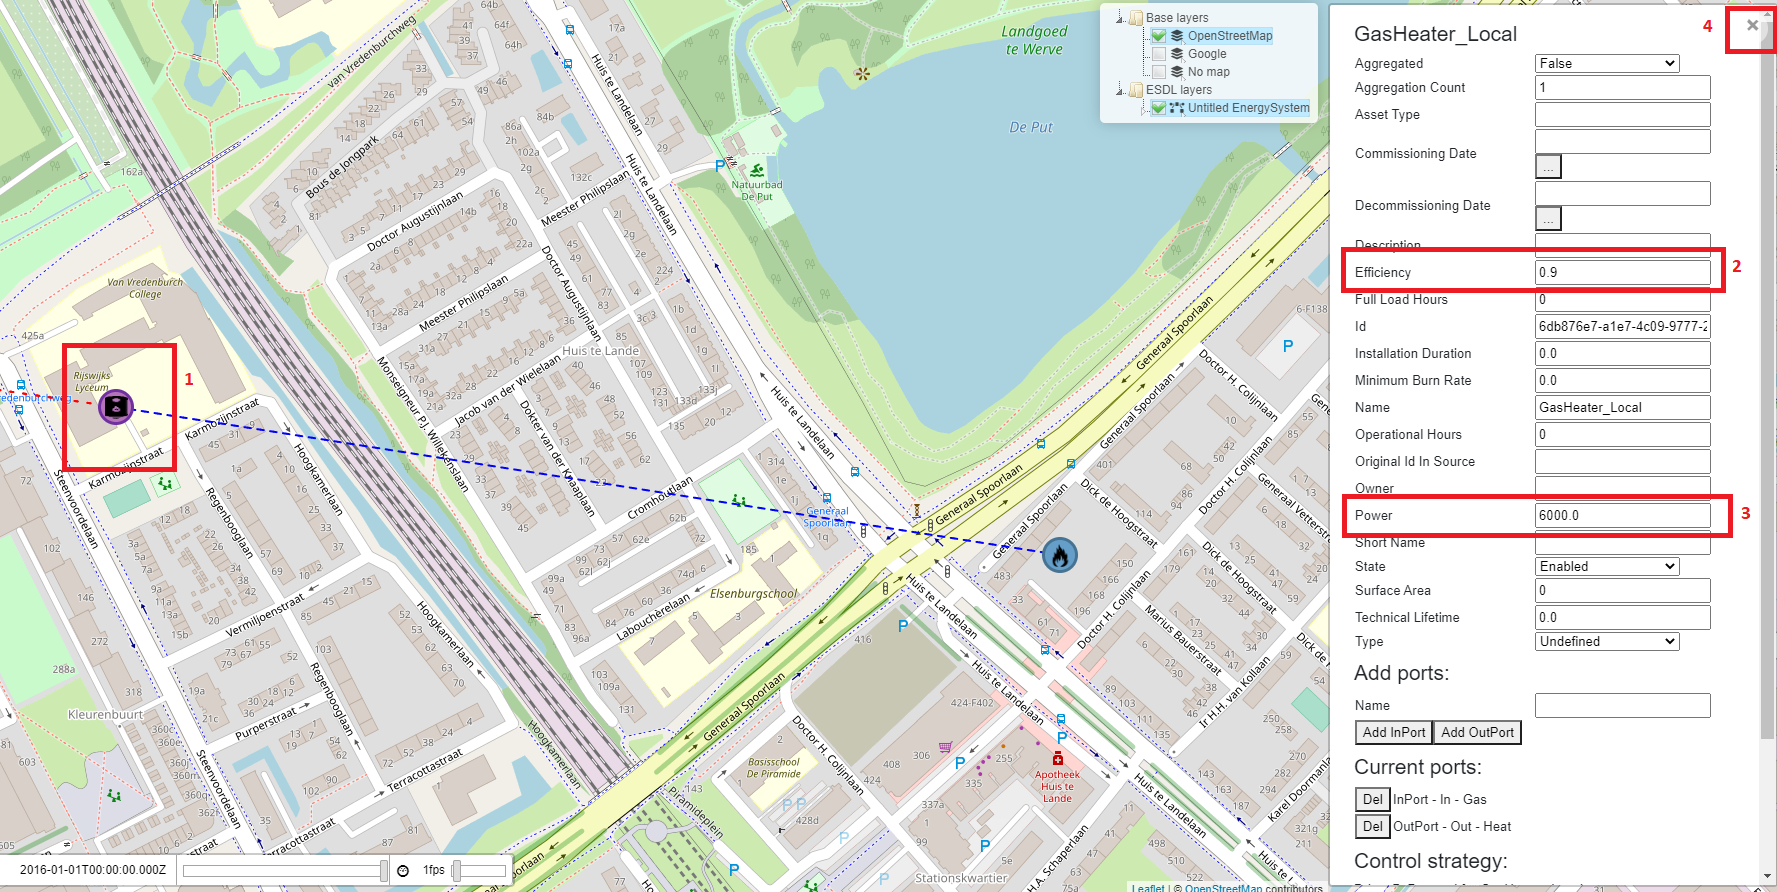
Figure 16: Configuring the GasHeater
Using an Import in an ESSIM simulation requires specifying maximum power (in Watts) and production type. Follow the steps from Figure 17.
Click on the Import icon (1).
Set power to 1000000 Watts (2). Fill in only the number, not the unit.
Set production type to Fossil (3)
Close the pop-up menu (4).
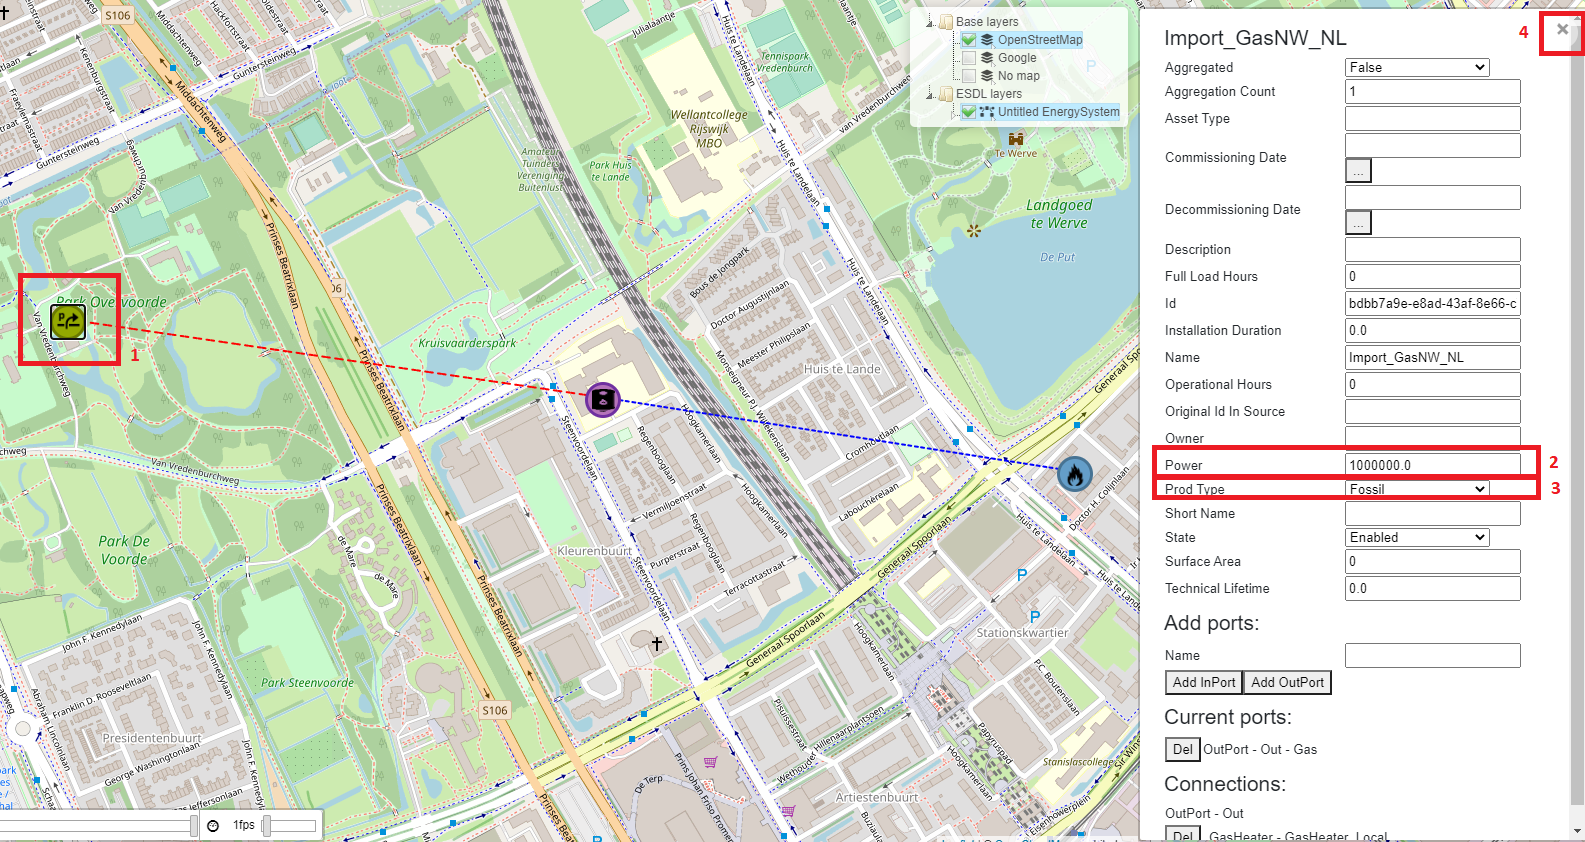
Figure 17: Configuring the GasImport
5. Setting load profile of HeatingDemand
The next step in configuring an EnergySystem for a basic ESSIM simulation is to add load and production profiles to EnergyAssets. In this basic scenario, a load profile is set for HeatingDemand EnergyAsset. To add a (load) profile:
Right-click on the HeatingDemand icon and select *Set profile of InPort*.
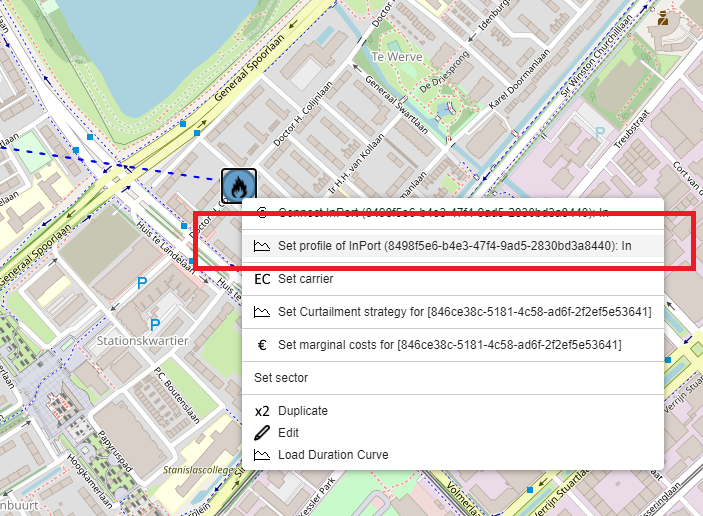
Figure 18: Setting profiles of EnergyAssets
A pop-up window appears with a list of possible profiles to choose from. MapEditor enables setting a range of load and production profiles, depending on scenarios and types of EnergyAssets.
Click on the dropdown menu (labeled ‘profile class’).
Choose Heating households (G1A), a heat demand profile of Dutch households, with hourly values.
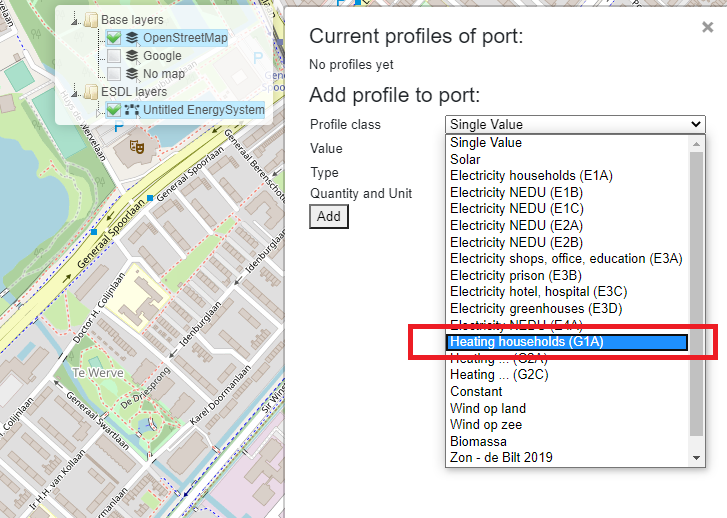
Figure 19: Choosing a load profile
As this is a normalized yearly profile, specify a Multiplier (1) and Quantity and Unit (2) for the profile. In this scenario, the yearly heating demand is 50 GJ.
Fill in 50 in the field ‘Multiplier’.
Select ‘Energy in GJ’ from the dropdown list ‘Quantity and Unit’.
Click *Add* (3) to close the pop-up window.
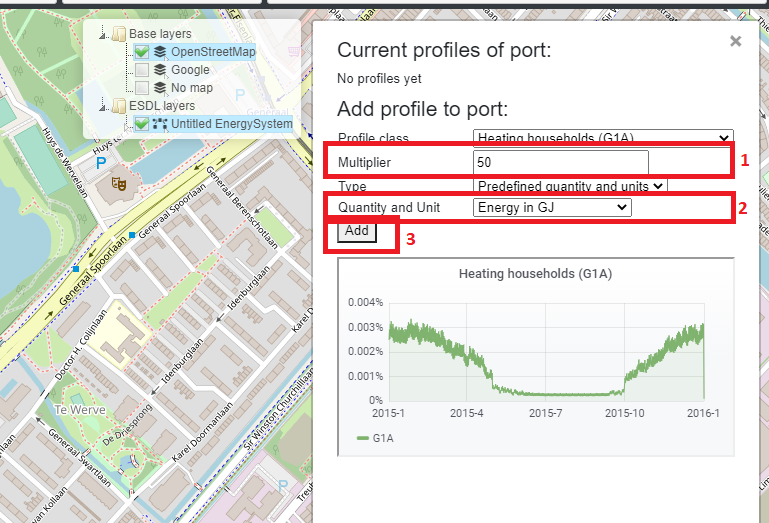
Figure 20: Setting a heating demand profile
Saving the model
Now is a good time to save the model. This model will be used in the next tutorials, as a base configuration.
To save the created EnergySystem, mouseover *File* menu item (1) and select *Save ESDL* (2) (see Figure 21). Save the file as ‘Tutorial1_Scenario.esdl’.
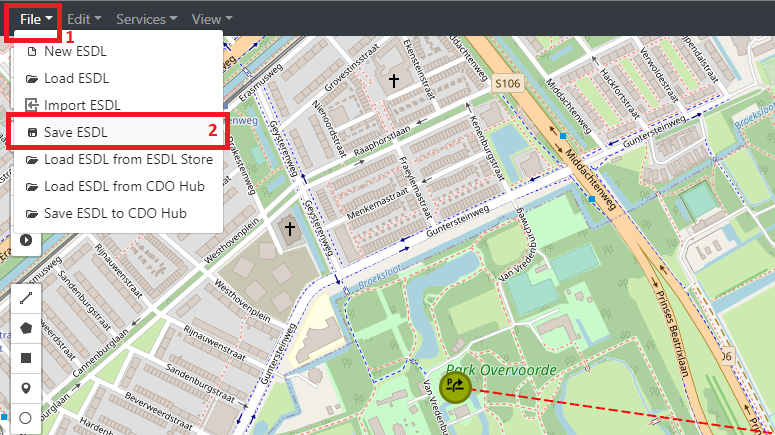
Figure 21: Saving an EnergySystem
Running an ESSIM simulation
Now that all the parameters are set, an ESSIM simulation can be run for this EnergySystem. To run a simulation:
Click the “Play” button on the left-hand side menu (see Figure 22).
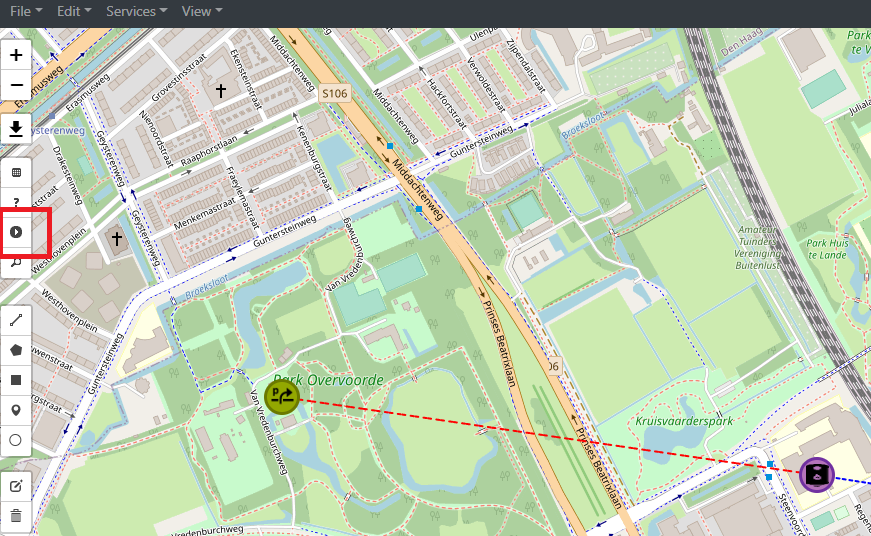
Figure 22: Running an ESSIM simulation
A pop-up window opens with ESSIM simulation parameters (see Figure 23).
Enter a simulation description (1).
Choose a year or a period to simulate (2). For this example, choose Year 2019.
Click *Run* (3) to run the simulation.
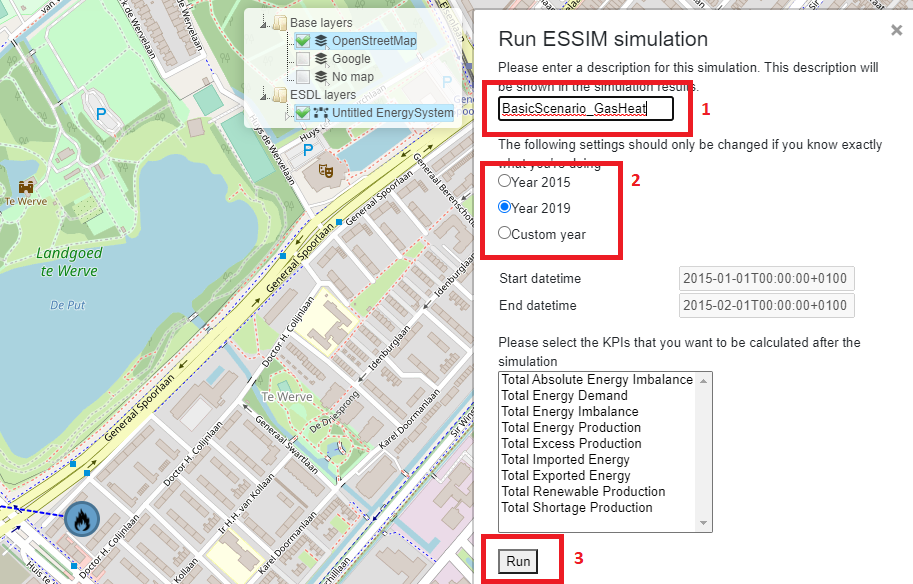
Figure 23: Configuring an ESSIM simulation
Once the simulation is finished, a link to a dashboard appears (see Figure 24). Clicking on the link opens a dashboard with ESSIM simulation results.
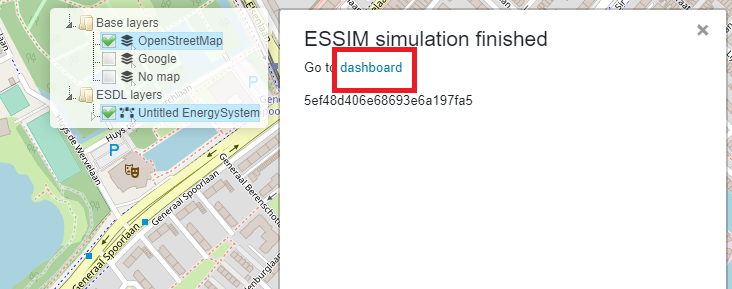
Figure 24: Navigating to ESSIM simulation results
Interpreting the results
ESSIM simulation results are displayed in a Grafana dashboard in a separate window. In the upper-right corner of the dashboard, Network Balances are displayed, indicating any potential imbalances. In this scenario, there are two networks: a gas network and a heat network. ESSIM displays results for each of these networks separately. Both heat and gas network are in balance, as indicated by a green OK flag (see Figure 25).
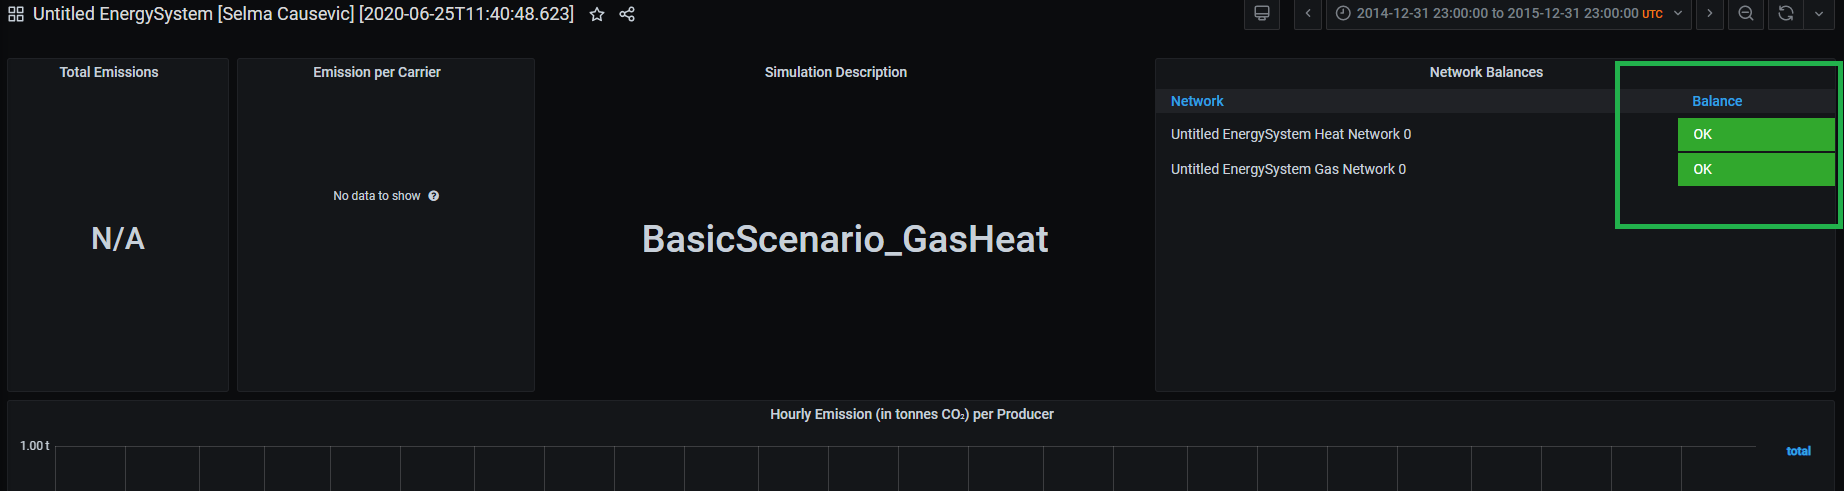
Figure 25: Network balances in an ESSIM simulation
To see load, production and imbalance in each of the networks on an hourly basis, scroll to the bottom of the page. As seen in Figure 26, results for each of the networks are displayed in a separate panel. The graphs show hourly data, while total production, demand and imbalance per energy asset is displayed on the right-hand side. Production is indicated by a negative sign, while demand is indicated by a positive sign.
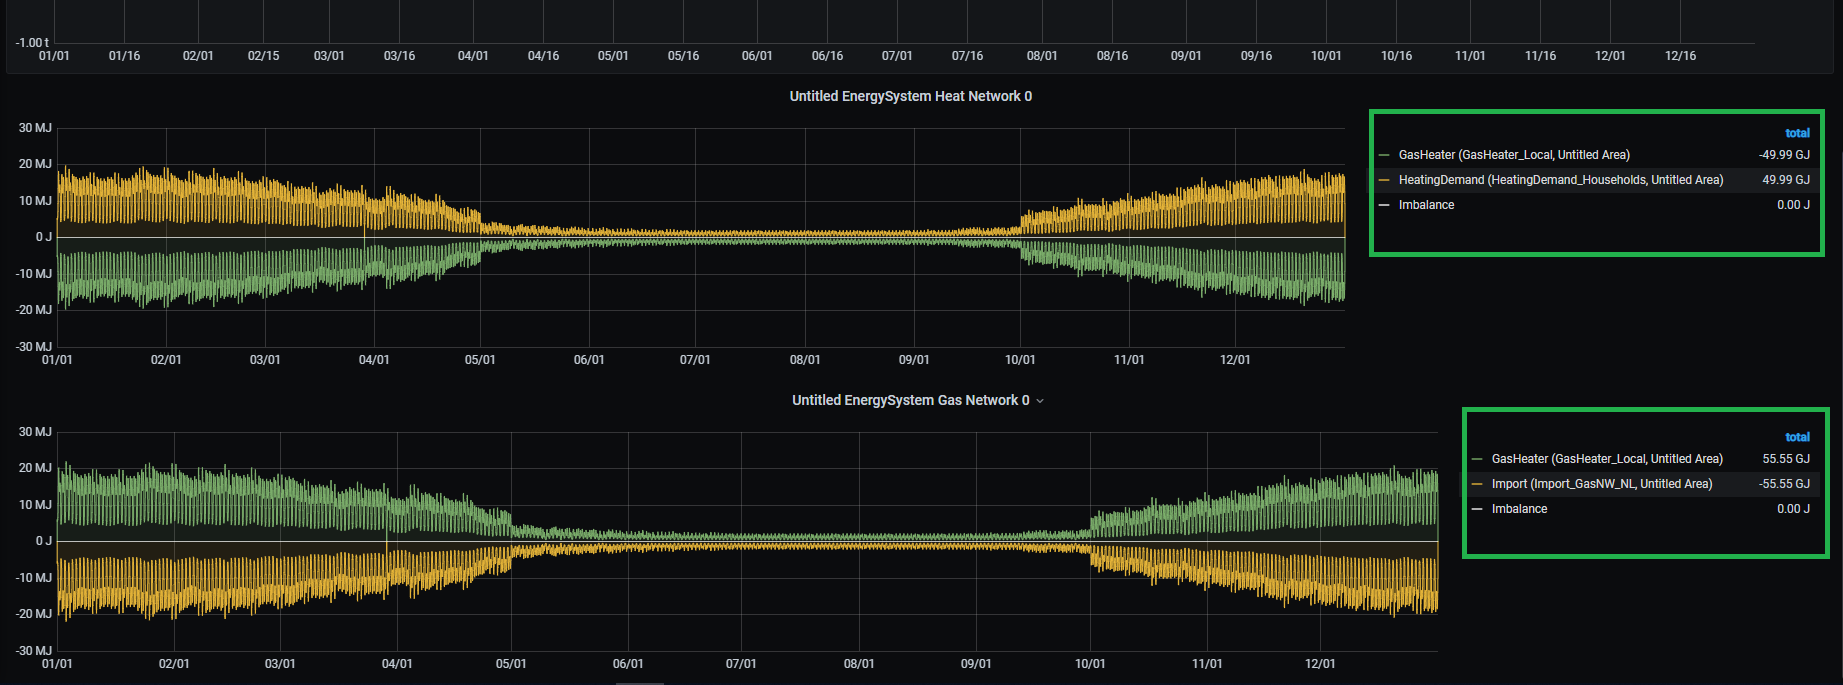
Figure 26: Load, production and imbalance in networks
To see details for a specific energy asset, for example the GasHeater, click on its name in the Heat Network panel (see Figure 27).
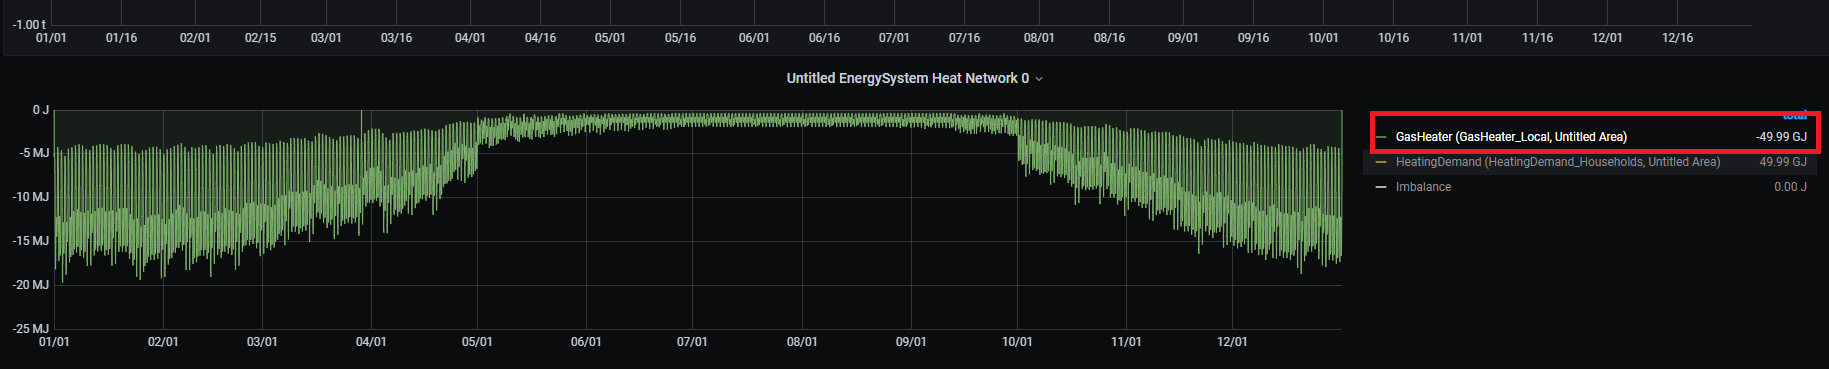
Figure 27: GasHeater production curve
Tutorial 2: Not so basic Energy System
Description
This tutorial demonstrates how to set preferences for specific (types of) producers in an EnergySystem to meet the demand of specific consumers. To do so, the EnergySystem from the previous tutorial is extended by adding another heat source, a HeatPump, which converts electricity to heat. Both the HeatPump and the GasHeater are connected to the sameHeatingDemand. To produce heat, the HeatPump is connected to an external electricity grid, an Import, and supplies the heat to the HeatingDemand.
Loading the base configuration
To continue with the model created in the previous tutorial, load the ‘Tutorial1_Scenario.esdl.
Select *File* (1).
Select *Load ESDL* (2) (see Figure 28).
Navigate to the file location and load the saved .esdl file.
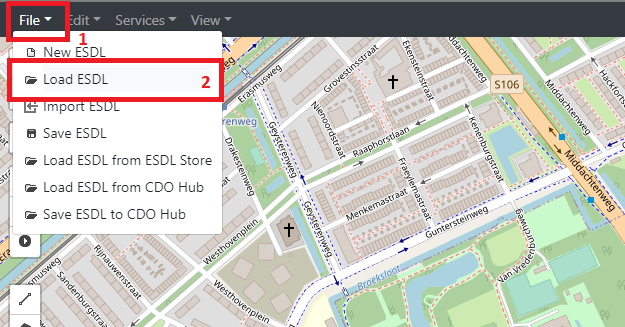
Figure 28: Loading an EnergySystem
Creating and configuring a HeatPump and an electricity Import
To extend the basic EnergySystem from the previous tutorial, follow these steps:
Create new [EnergyAssets]
Import EnergyAsset
Power: 1000000 W
Production Type: Fossil
HeatPump EnergyAsset
Power: 3000 W
Efficiency: 1.0 (100%)
Coefficient of performance (COP): 3.0
Connect the EnergyAssets
OutPort of the Import with the InPort of the HeatPump
OutPort of the HeatPump with the InPort of the HeatingDemand
Create an electricity Commodity
Assign the electricity Commodity to the electricity Import
Re-assign the heat Commodity to the HeatingDemand
In this scenario, there are two heat sources supplying the HeatingDemand: a GasHeater and a HeatPump. In the current setting, an ESSIM simulation treats both sources equally and uses them at the same time to meet the heating demand of the consumer (see Figure 29).
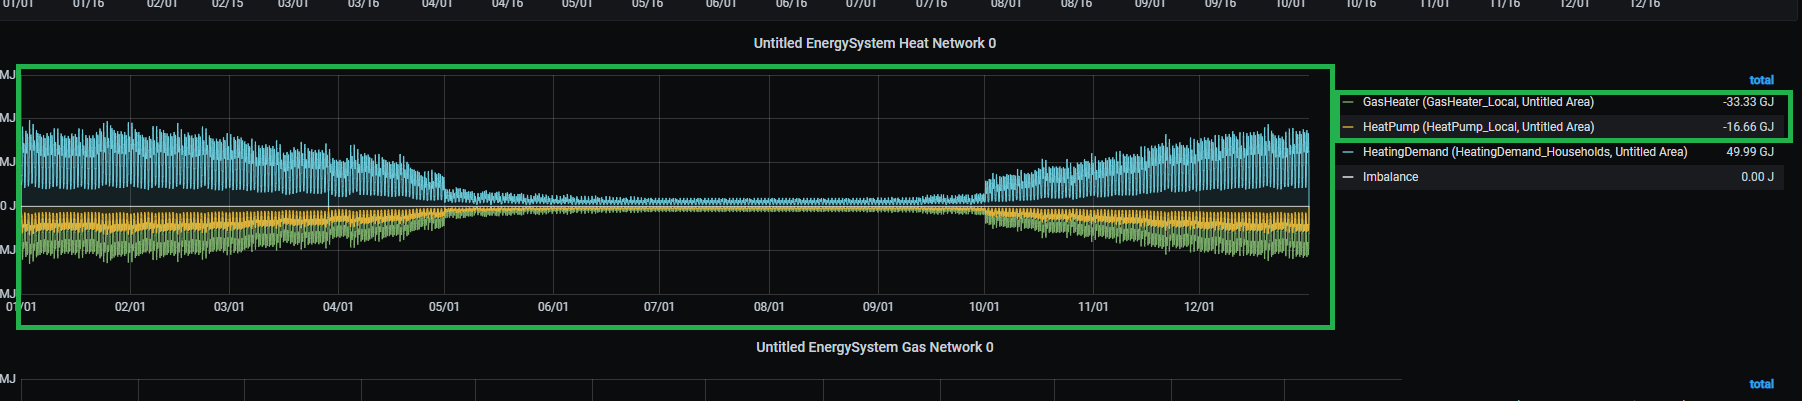
Figure 29: HeatPump and GasDemand as producers of equal priority
However, in this scenario, we would like to use the HeatPump to its maximum capacity at all times, and use the GasHeater only at times when there is not enough production from the HeatPump. Therefore, HeatPump needs to have higher priority that the GasHeater.
Specifying marginal costs of HeatPump and GasHeater EnergyAssets
ESSIM uses the concept of marginal costs to determine the priority of EnergyAssets (or the order in which EnergyAssets are used). In ESSIM they are specified in relative terms to each other, not in absolute terms. They can have a minimum value of 0 (the cheapest producer) and a maximum value of 1 (the most expensive producer). To meet an energy demand, ESSIM first uses the cheapest producer (the highest priority) up to its maximum power. Therefore, to determine the order in which heat sources are used, marginal costs have to be set for GasHeater and HeatPump. Since we want to first use the HeatPump at all times possible, it will have lower marginal costs compared to that of the GasHeater.
To set the marginal costs of the HeatPump;
Right-click on its icon (1) and select *Set marginal costs* (2) (see Figure 30).
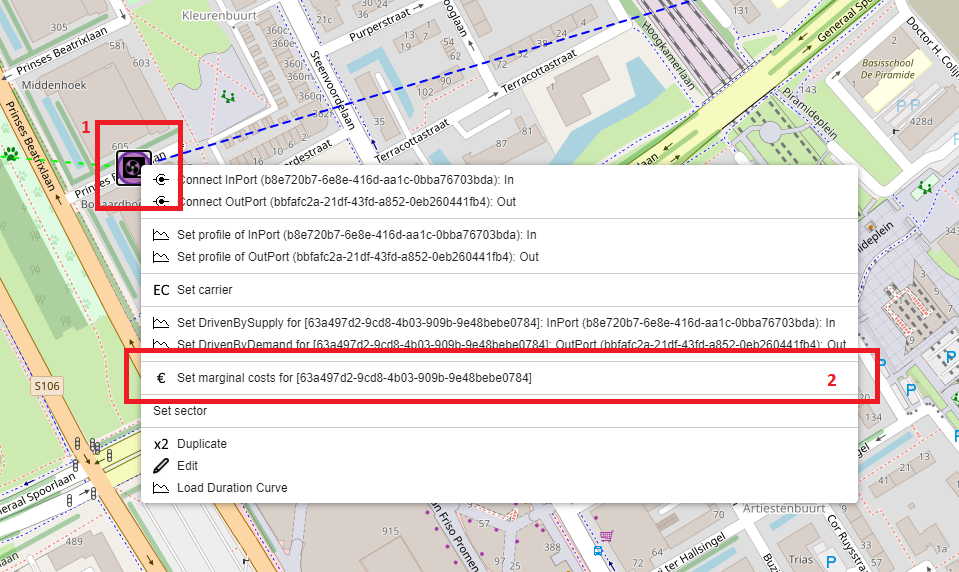
Figure 30: Setting marginal costs of the HeatPump
Set the costs to 0.4 (1).
Click *Set costs* to save changes and close the window (2) (see Figure 31).

Figure 31: Setting marginal costs of the HeatPump
Repeat the same procedure for the GasHeater, but set its costs to 0.6.
The priorities of heat producers are now set. Marginal costs can be changed or checked following the same procedure of setting the initial values. The EnergySystem scenario can now be simulated.
Running an ESSIM simulation and interpreting the results
Run the simulation as shown in Section Tutorial 1: Basic Energy System, Running an ESSIM simulation. ESSIM results now show three networks, namely Gas, Heat and Electricity.
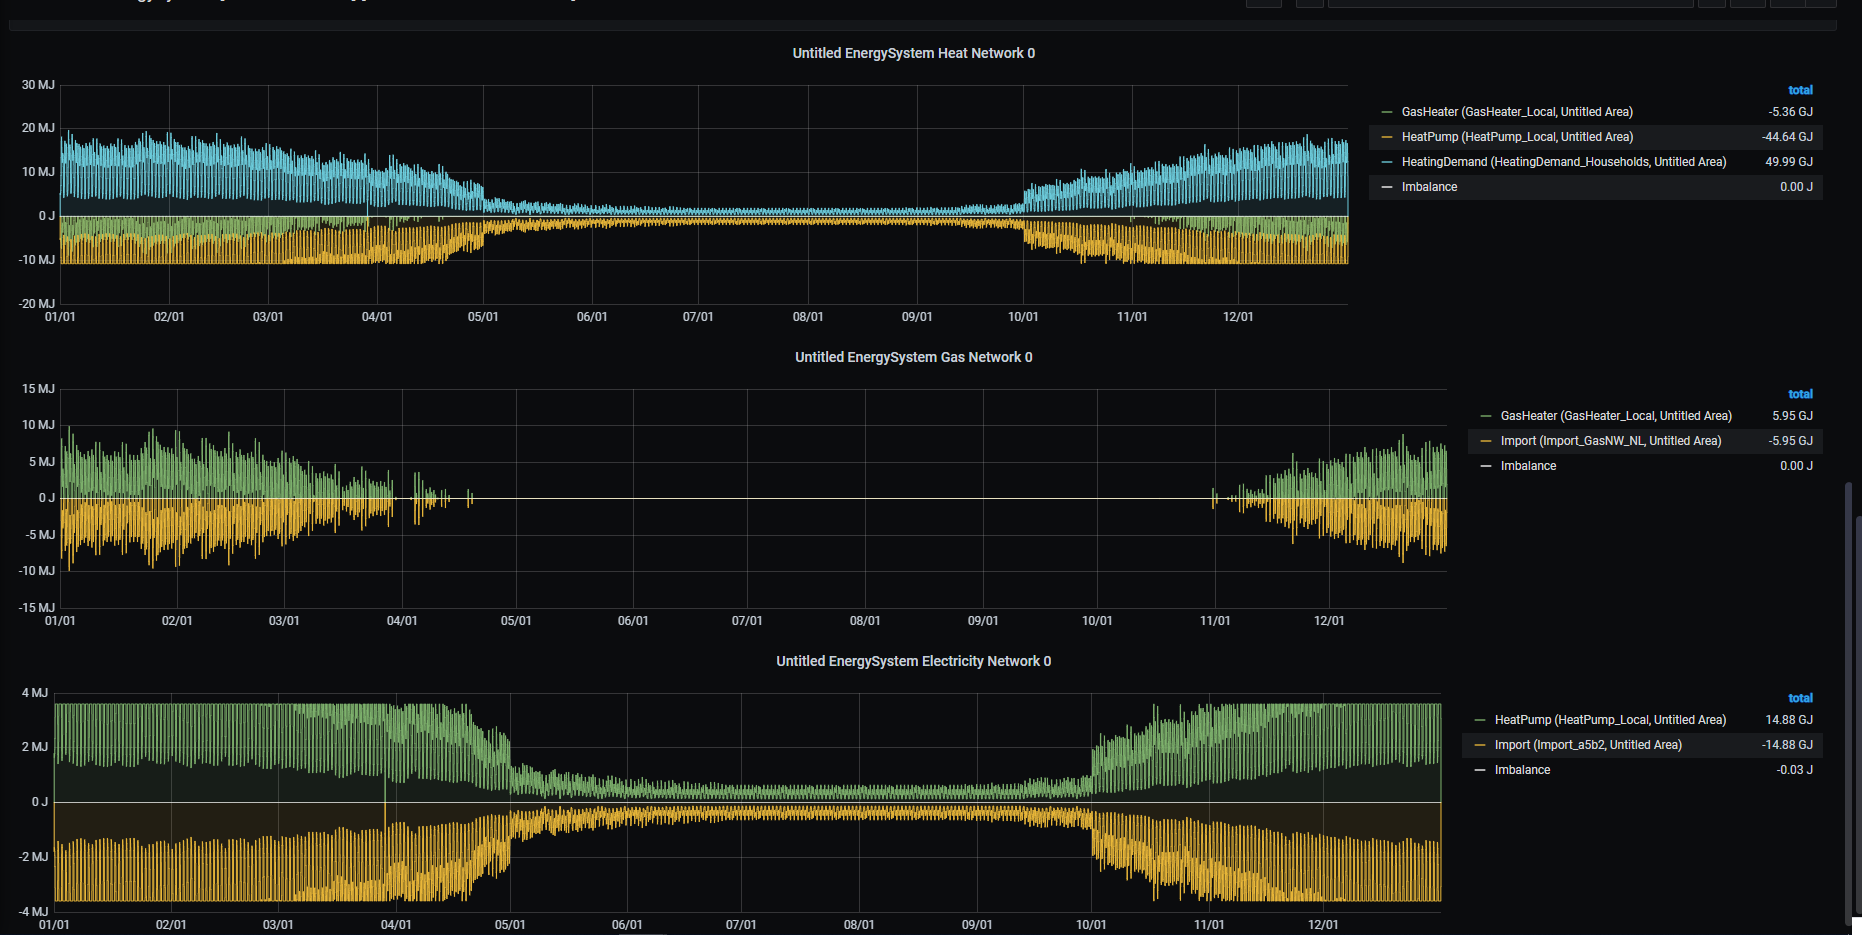
Figure 32: ESSIM simulation results
To explore the effect of prioritization by setting marginal costs, observe the Heat Network panel.
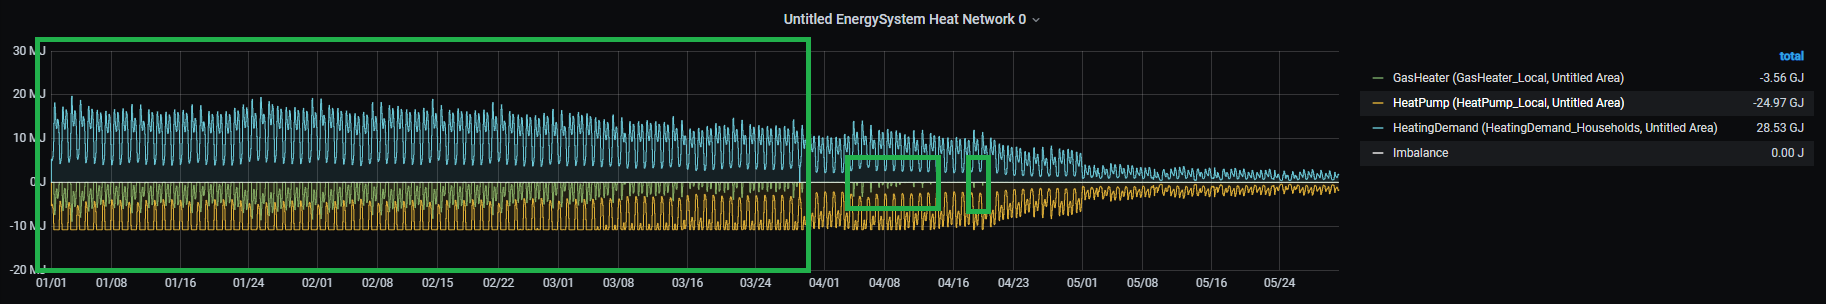
Figure 33: Heat Network with producer priorities
Compared to Figure 27, where the HeatPump and the GasHeater are producing at the same time, Figure 31 shows that the GasHeater is producing only at times when there is not enough production from the HeatPump to meet all the demand. This is better illustrated if we zoom-in into a specific period. To zoom-in, simply click and drag the mouse over the desired period. As seen in Figure 34, the GasHeater supplies heat only at specific intervals of time (see the green graph).
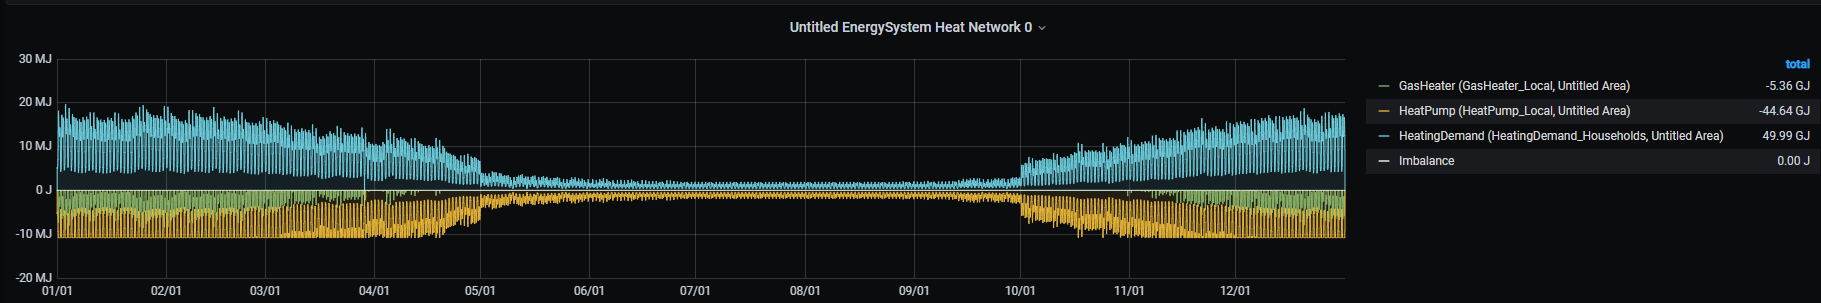
Figure 34: HeatPump as the highest priority producer
Saving the model
To save the model, follow the steps from Tutorial 1: Basic Energy System, Saving the model. Name the model ‘Tutorial2_Scenario.esdl’.
Tutorial 3: Renewable source export excess
Description
This tutorial demonstrates a scenario where overproduction from a local renewable resource (a PV park) is exported to the backbone electricity grid. The PVPark and the electricity Import are connected to a local ElectricityNetwork, which supplies electricity to the HeatPump.
Load the model
To build upon the previously created EnergySystem, load the ‘Tutorial2_Scenario.esdl’ file from Tutorial 2: Not so basic Energy System. To load the model, follow the steps from Tutorial 2: Not so basic Energy System, Loading the base configuration.
Creating and Configuring the ElectricityNetwork, PVPark and Export
In this tutorial, a local PVPark is added as a local electricity source. As the HeatPump is the only electricity consumer in this scenario, both PVPark and Import are producing to meet this demand. To connect both the PVPark and the Import to the HeatPump, this tutorial creates a local ElectricityNetwork to which all electricity consumers and producers are connected.
To do so, the Import and the HeatPump from Tutorial 2 first have to be disconnected. To remove the connection between the assets, follow the steps indicated in Figure 35:
Click on the Import asset (1).
Scroll to the bottom of the pop-up menu where Asset connections are listed.
Click on *Del* OutPort connection to the HeatPump (2).
The Import and the HeatPump and now disconnected.
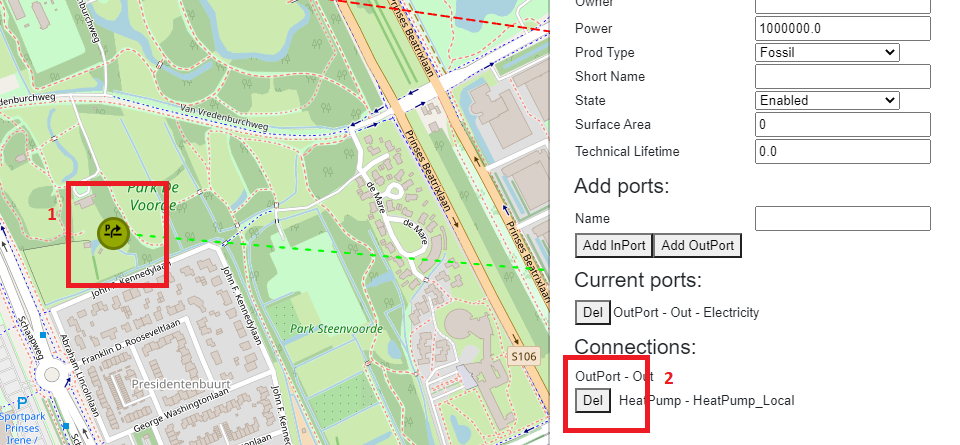
Figure 35: Removing connections between EnergyAssets
The next step is to create a local ElectricityNetwork and connect the Import and the HeatPump to this network. To create an ElectricityNetwork EnergyAsset, follow the steps from Tutorial 1: Basic Energy System.
Next, a PVPark EnergyAsset is created. Creating a PVPark differs from the previously introduced EnergyAssets. To create a PVPark, follow the steps indicated in Figure 36:
Select the PVPark item from the dropdown menu (1).
Click on the map to position it (2).
As indicated by a pentagon shape on the left-hand menu (see the green mark), a PVPark is a polygon shape, requiring multiple points to be drawn.
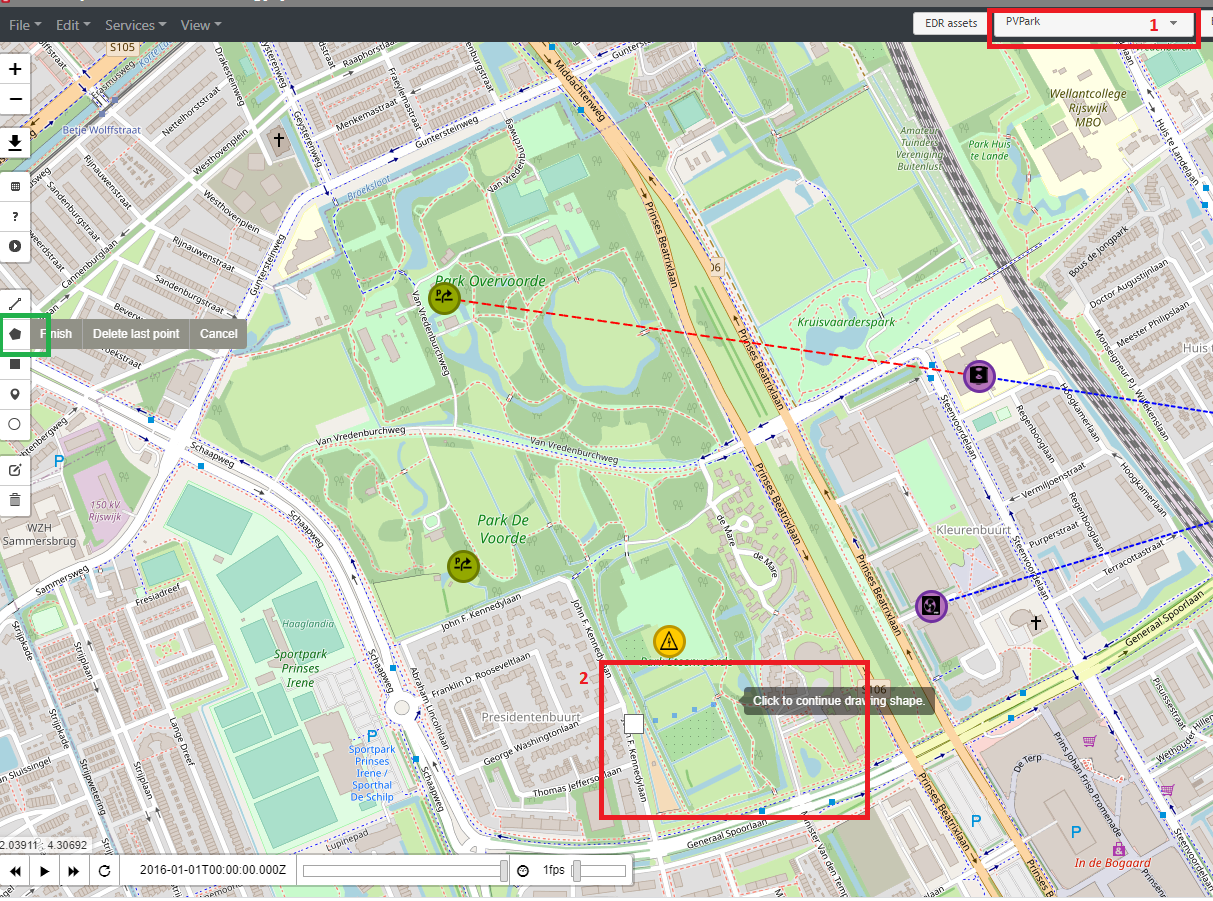
Figure 36: Creating a PVPark EnergyAsset
Continue drawing the desired shape of the PVPark by clicking on the map to create its vertices (1) (see Figure 37).
Select *Finish* to finish the shape (2).
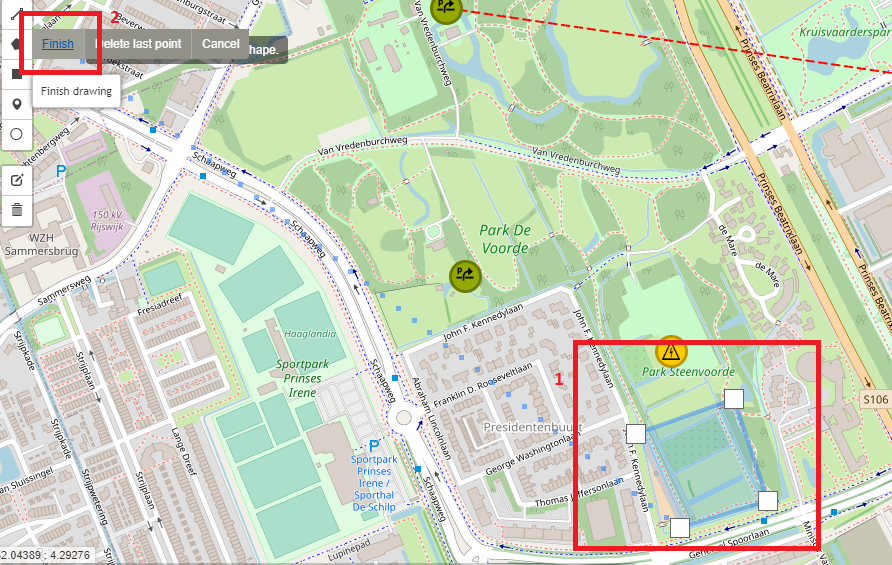
Figure 37: Creating a polygon shape of the PVPark
Figure 38 shows the created PVPark EnergyAsset.
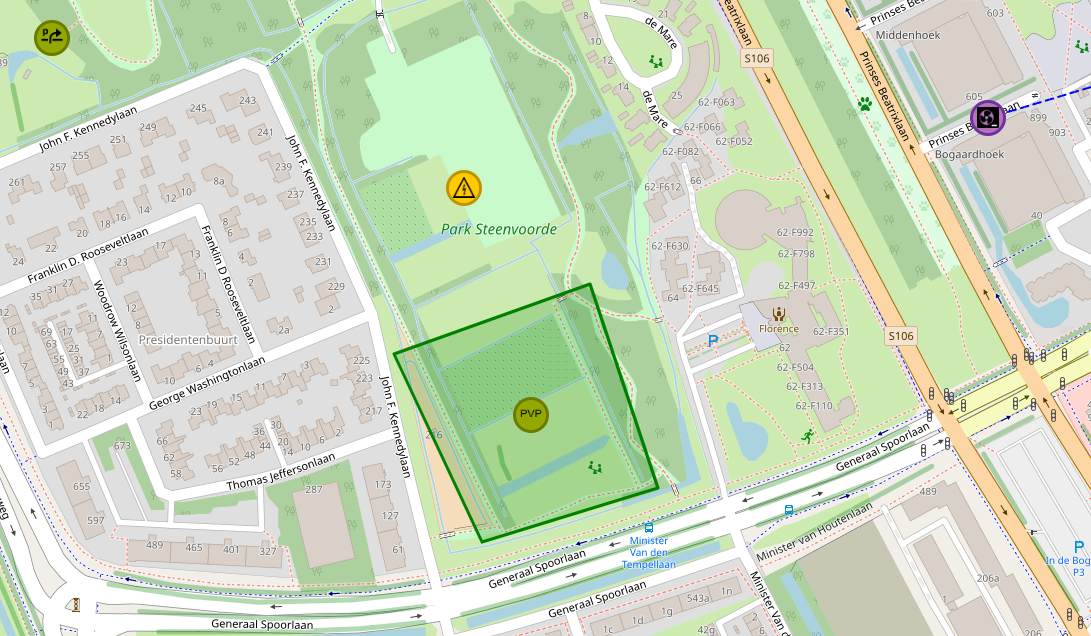
Figure 38: The created PVPark EnergyAsset
Next, add a production profile to the PVPark.
Right-click on the PVPark icon.
Choose Solar from the drop-down menu of the Profile class (1), a normalized solar production profile on an hourly basis.
In this scenario, the yearly production of this PVPark is 25 GJ.
Enter 25 for the Multiplier.
Leave Energy in GJ as Quantity and Unit.
Click on *Add* (3) to close the pop-up window and save the profile (see Figure 39).
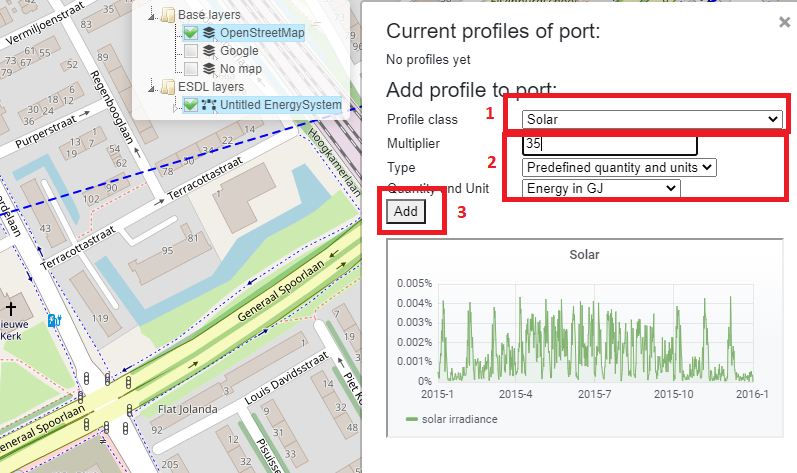
Figure 39: Setting the production profile of the PVPark
To change any other PVPark parameter (e.g. the name), click on its icon and enter the desired details.
Make sure that Renewable is selected as Production Type.
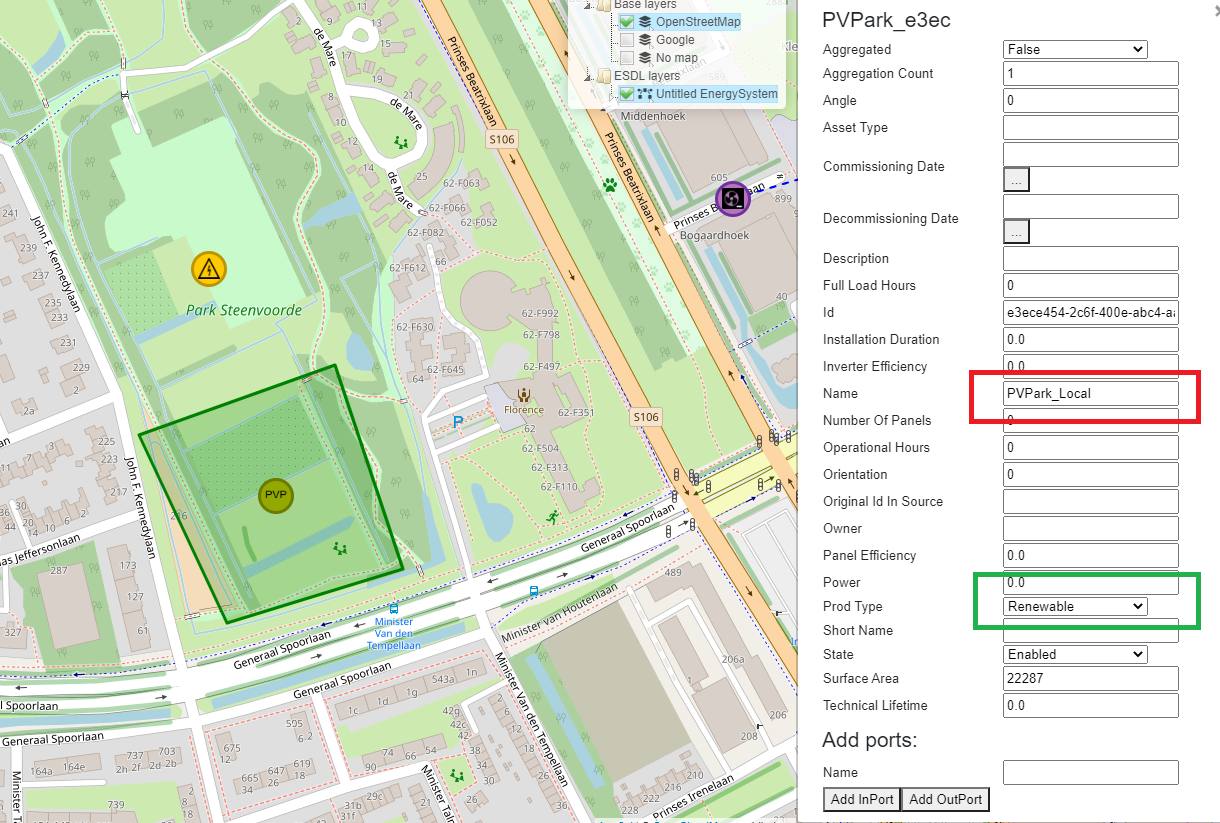
Figure 40: Configuring the parameters of the PVPark
The next step is to connect the Import, the PVPark and the HeatPump to the ElectricityNetwork, and assign energy Carriers. To do so, follow the steps from Tutorial 1: Basic Energy System:
Connect the OutPort of the Import to the InPort of the ElectricityNetwork.
Connect the OutPort of the PVPark to the Inport of the ElectricityNetwork.
Connect the OutPort of the ElectricityNetwork to the InPort of the HeatPump.
Assign electricity Commodity to the ElectricityNetwork.
Refresh the browser to see the changes.
Check the connections by selecting an EnergyAsset and looking at its ‘Connections’ in the pop-up menu.
Figure 41 shows the created EnergySystem with a PVPark.
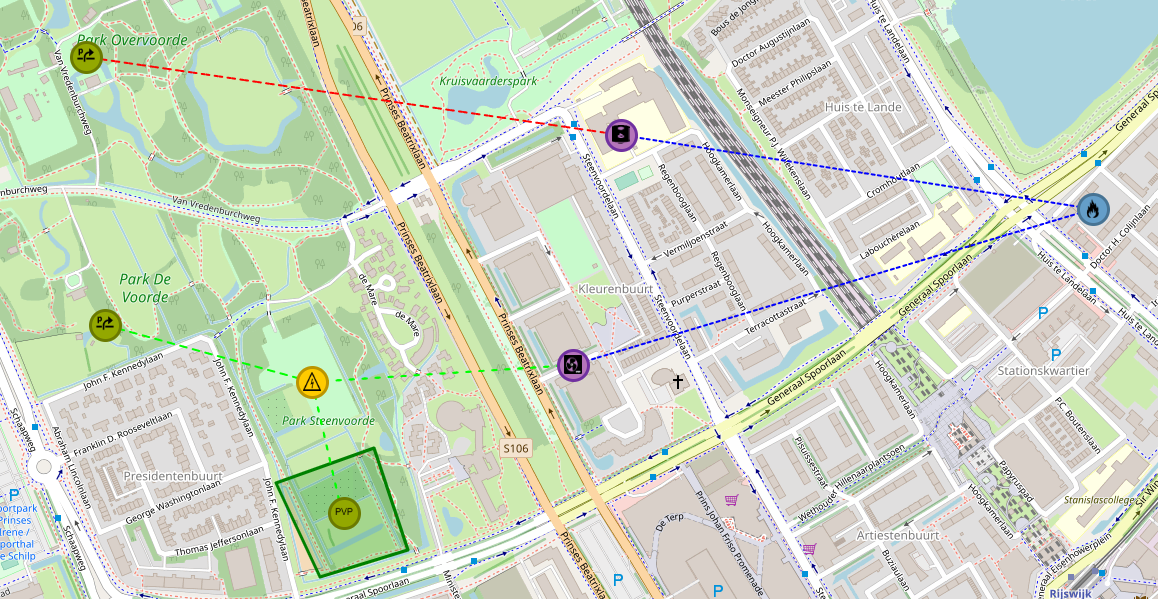
Figure 41: EnergySystem with a PVPark
Running and interpreting an ESSIM simulation
Running an ESSIM simulation for the created scenario generates an imbalance in the ElectricityNetwork (see Figure 42). Positive imbalance indicates that there is overproduction from the PVPark, causing the system failure.
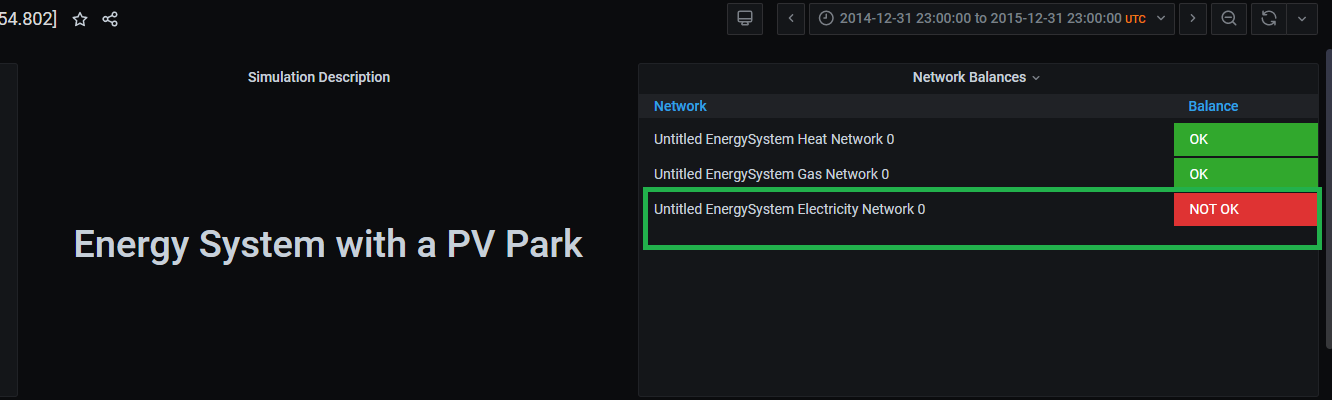
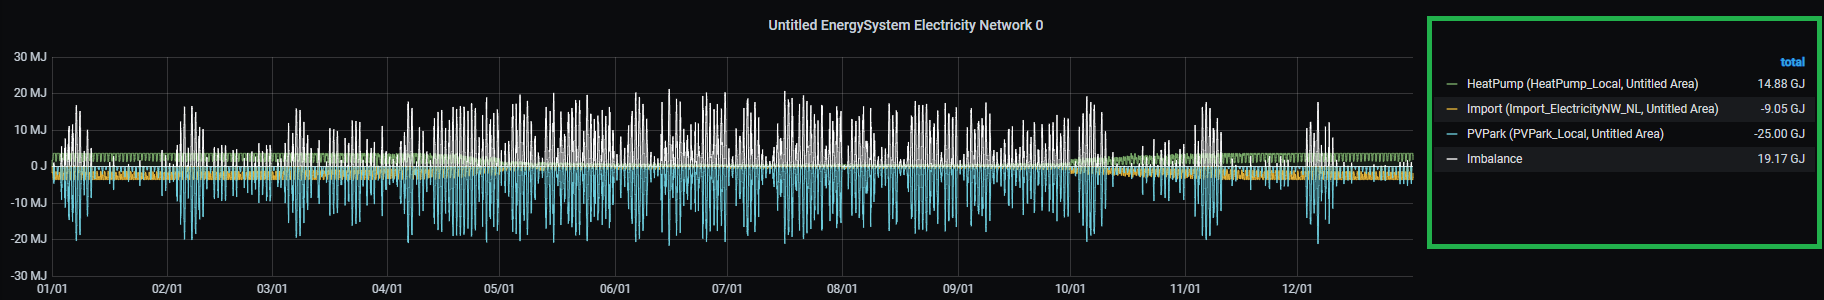
Figure 42: ElectricityNetwork imbalance
To prevent the system failure, overproduction generated by the PVPark can be exported to an external electricity consumer (the backbone gird, for example). To simulate export to the backbone grid, create an Export EnergyAsset by following the steps from Tutorial 1: Basic Energy System.
Connect the Export to the ElectricityNetwork.
Assign electricity Commodity as a carrier to Export.
Set the power to 10000 Watts, as Export has to consume all excess production from the PVPark.
Set the marginal costs of Export to 0.01 (a cheap consumer) to make sure that the local electricity demand is met first.
Figure 43 shows the created EnergySystem with a PVPark and an Export.
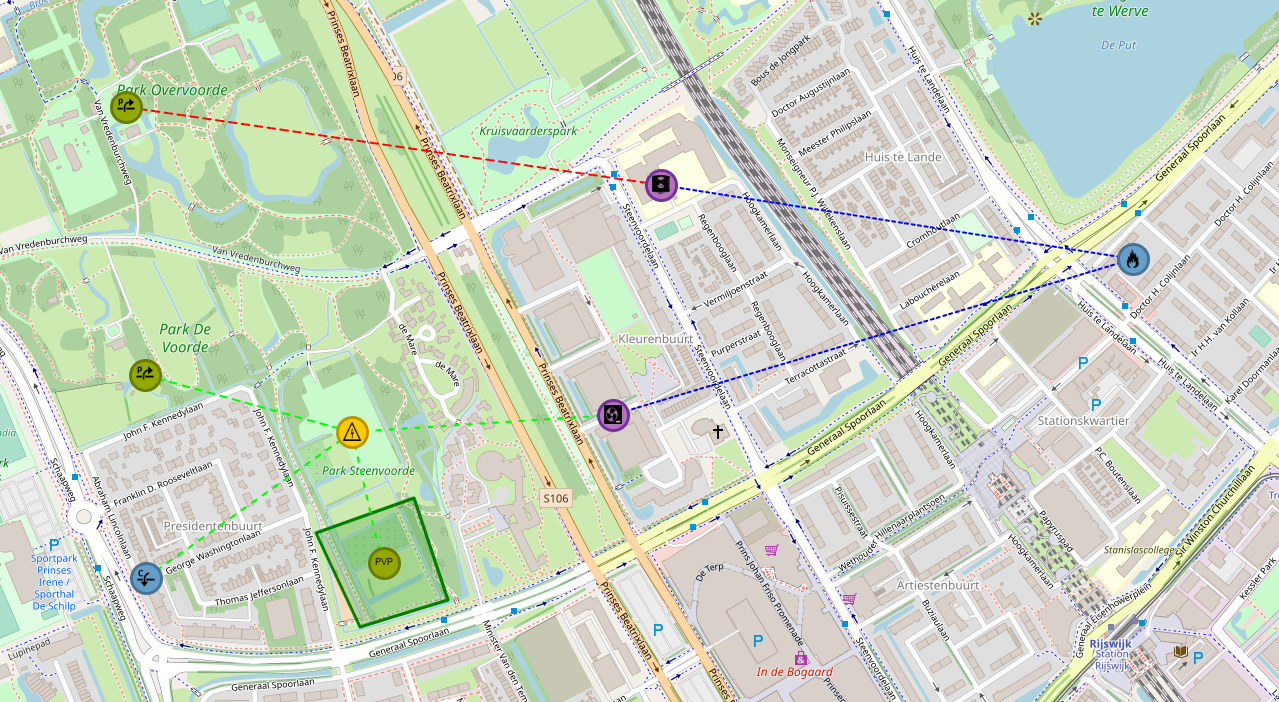
Figure 43: EnergySystem with a PVPark and an Export
Running an ESSIM simulation for this scenario results in balances in all the energy networks. As seen in Figure 44, at times when the PVPark generates excess production, it is consumed by the Export EnergyAsset, resulting in system balance.
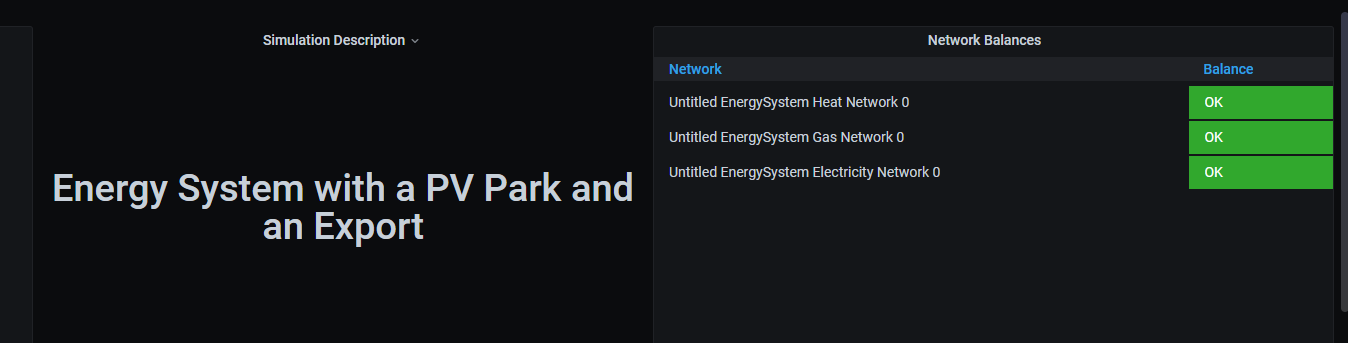
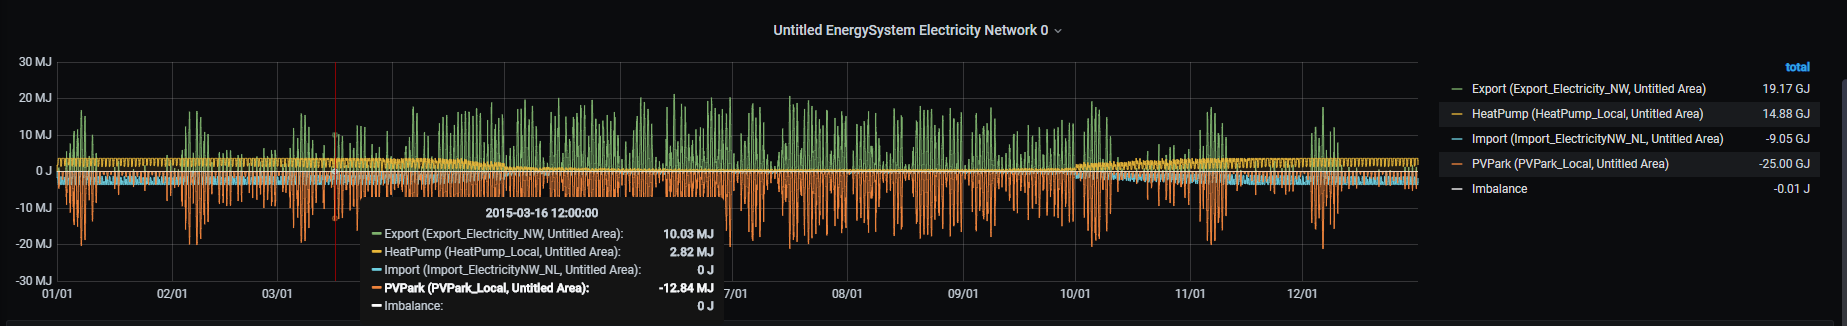
Figure 44: ElectricityNetwork in balance due to Export
Inspecting Load Duration Curves
Sometimes it can be insightful to inspect the loads on the Assets. MapEditor offers a quick inspection of the Load Duration Curves (LDCs) of the assets. The LDC displays the hourly values of the load sorted from high to low, thereby showing the frequency of load capacity utilization. For example, LDCs can give an insight into the number of hours energy is imported from and exported to the backbone grid, or for how long energy production or consumption was above a certain threshold. LDCs can be inspected after running an ESSIM simulation.
To inspect an LDC of the Import EnergyAsset, follow the steps from Figure 45:
Right-click on the Import EnergyAsset (1)
Select Load Duration Curve (2)
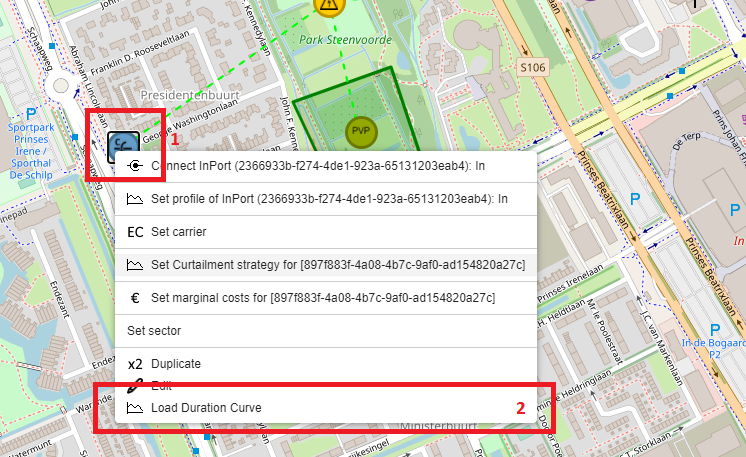
Figure 45: Loading LDC of Export EnergyAsset
A pop-up window opens with Export’s LDC (see Figure 46). LDC shows that energy is exported during approximately 3200 hours, and that the peak export for the entire simulation run is around 6k. The maximum power of the EnergyAsset is indicated by a red line, and the load stayed well below that.
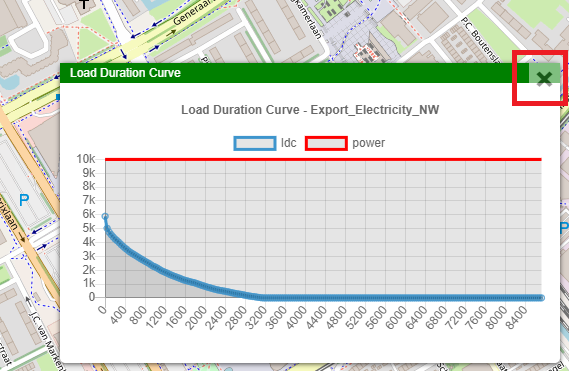
Figure 46: Load Duration Curve of Export EnergyAsset
To close the LDC window, select *x*
Saving the model
To save the model, follow the steps from Tutorial 1: Basic Energy System, Saving the model. Name the model ‘Tutorial3_Scenario.esdl’.
Tutorial 4: Add storage to prevent export
Description
This tutorial demonstrates an EnergySystem that uses local energy storage, a Battery, to store overproduction from the local PVPark, thereby preventing electricity export. Both the PVPark and the Battery are connected to a local ElectricityNetwork.
Load the model
To build upon the previously created EnergySystem, load the ‘Tutorial3_Scenario.esdl’ file from Tutorial 3: Renewable source export excess. To load the model, follow the steps from Tutorial 2: Not so basic Energy System, Loading the base configuration.
Creating and Configuring a Battery Storage EnergyAsset
The main aim of this exercise is to prevent export of local PVPark production by placing a Battery. Configuring a Battery storage EnergyAsset requires setting a number of parameters such as capacity, charge and discharge rates, and fill level with which the battery starts the simulation. Therefore, to properly configure the Battery, we have to first observe the Export EnergyAsset from the previous simulation. Run an ESSIM simulation and select the Export EnergyAsset.
As seen in Figure 47 and Figure 48, the total consumption of Export is 19.17 GJ, and the peak consumption is 21.21 MJ. Configuring a Battery EnergyAsset requires setting its capacity, fill level, and maximum charge and discharge rates. Battery capacity indicates the maximum amount of energy a Battery can store (in Joules), fill level indicates at what percentage of capacity a Battery is charged at the beginning of the simulation, while maximum charge and discharge rate indicate the maximum power at which a Battery can charge or discharge, at each time step. As the peak demand of export is 21.21 MJ (5891.6 Watts), we can take that value as the maximum charge and discharge rate.
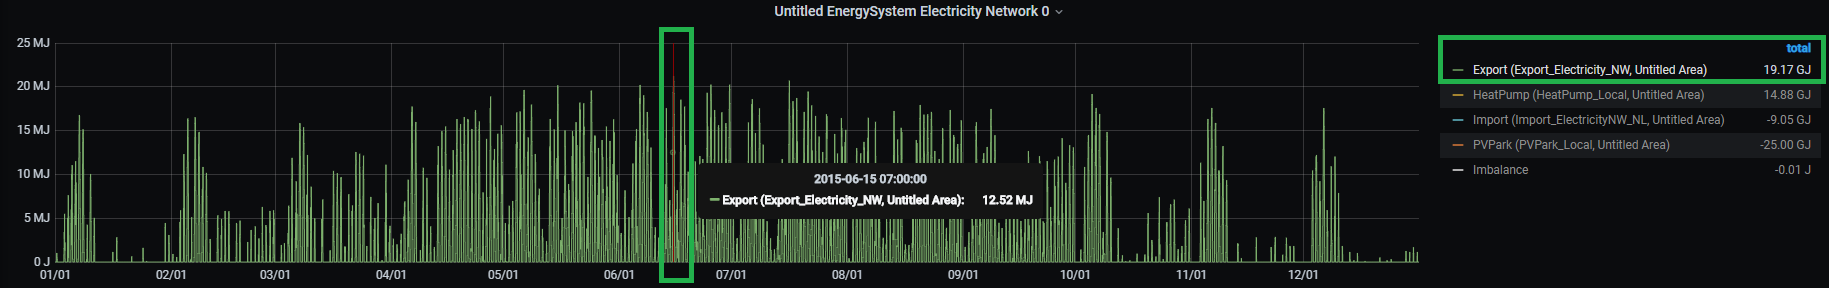
Figure 47: Total and peak consumption of Export EnergyAsset
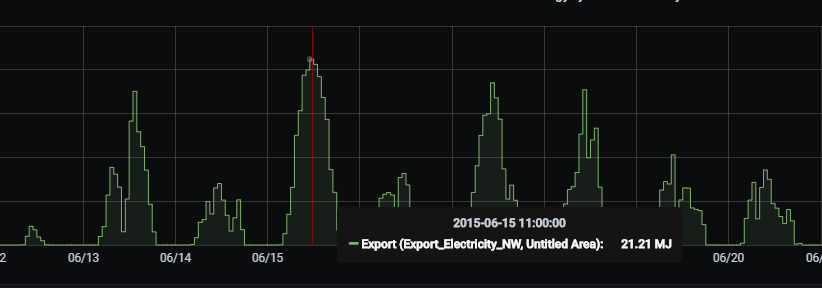
Figure 48: Peak consumption of Export EnergyAsset
To extend the EnergySystem from the previous tutorial, follow the next steps:
Create and configure a Battery EnergyAsset (see Figure 49)
Capacity: 5000000000 Joules
Max Charge Rate: 6000 Watts
Max Discharge Rate: 6000 Watts
Fill level: 0.2
Set StorageStrategy (In earlier versions of this tutorial, the below marginal costs were mixed up)
Marginal charge costs: 0.2
Marginal discharge costs: 0.8
Connect the Battery to the ElectricityNetwork
InPort of the Battery with OutPort of the ElectricityNetwork
Re-assign the electricity Commodity to the ElectricityNetwork
Set marginal costs of other EnergyAssets
Import: 0.9
PVPark: 0.1
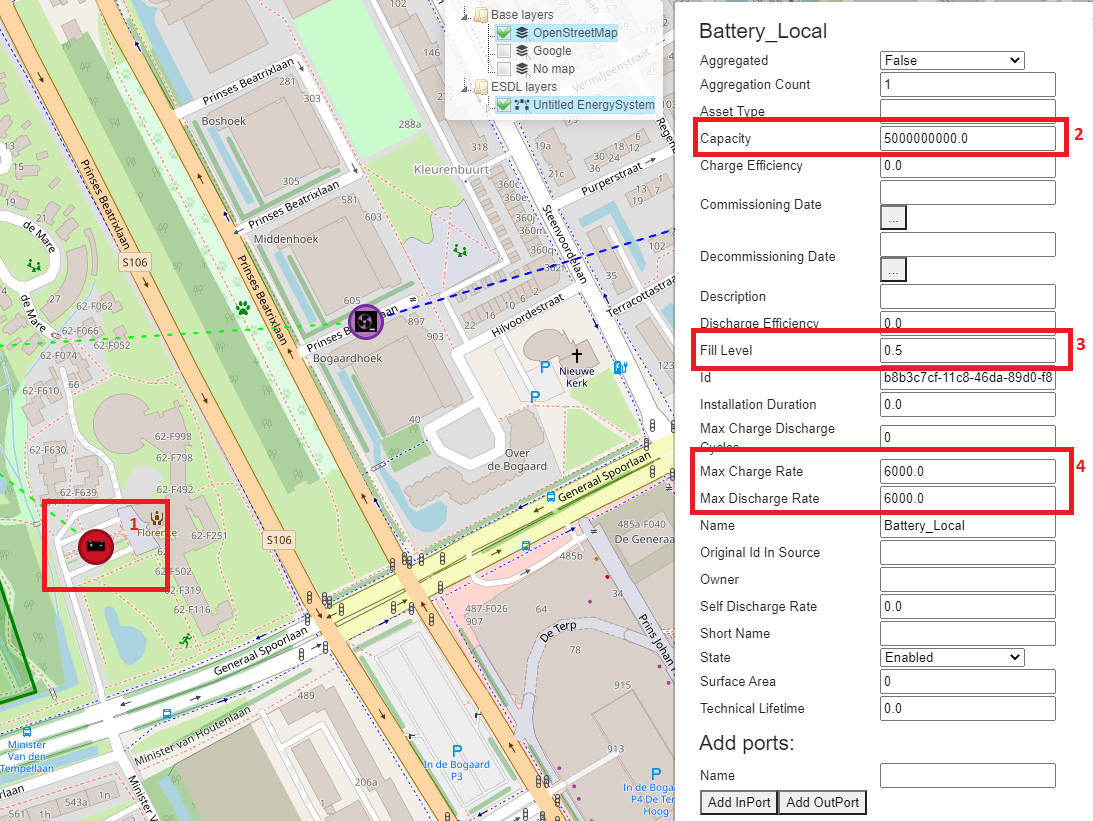
Figure 49: Configuring a Battery EnergyAsset
Figure 50 shows the newly configured EnergySystem.
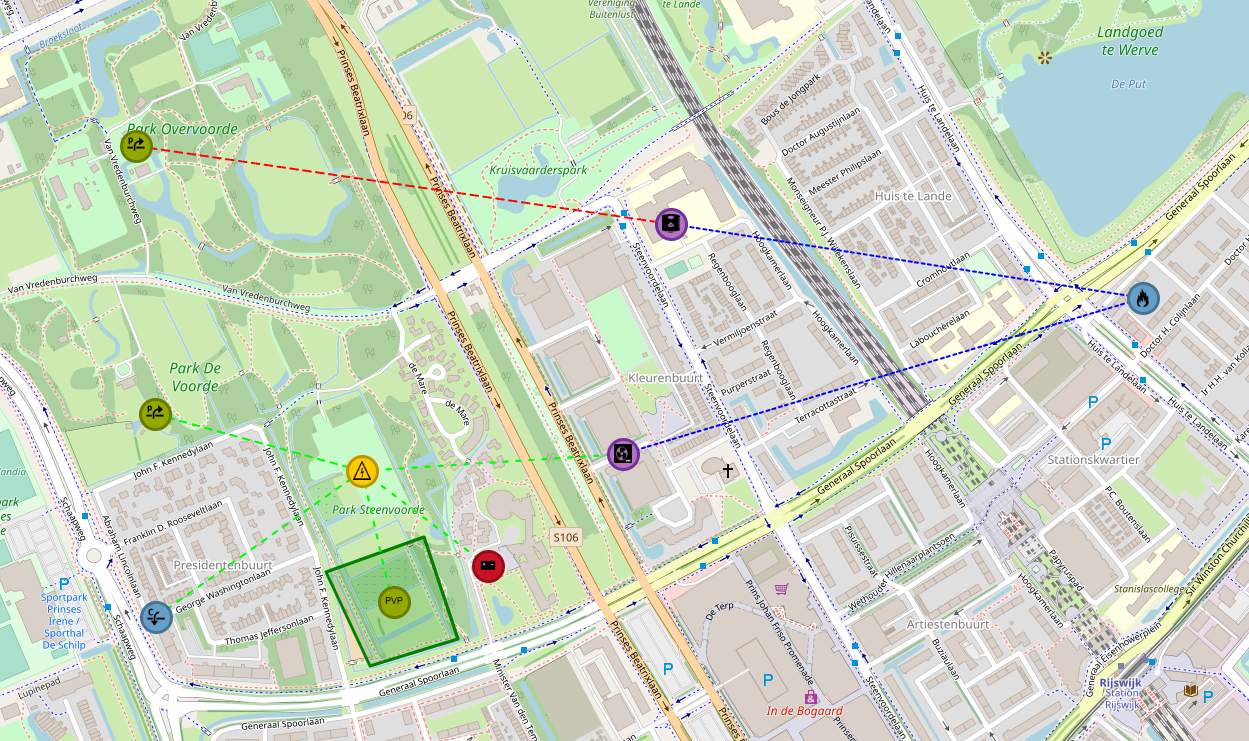
Figure 50: EnergySystem with a local Battery storage
Running and interpreting an ESSIM simulation
To show the effect of placing a Battery, run an ESSIM simulation following the instructions from Tutorial 1: Basic Energy System, Running an ESSIM simulation. Figure 49 and Figure 50 show the results for the simulation for ElectricityNetwork which show that placing a local Battery prevented not only Export, but also Import. The Battery starts charged at 20% its full capacity (0.2 fill level). Whenever there is overproduction from the PVPark, it is stored in the Battery. As Battery is configured as a cheaper producer compared to Import, it discharges during hours when there is not enough electricity production from the local PVPark. Observing the state-of-charge (SOC) of the Battery, we can see that it reaches around 55% towards the end of the simulation (see Figure 51).
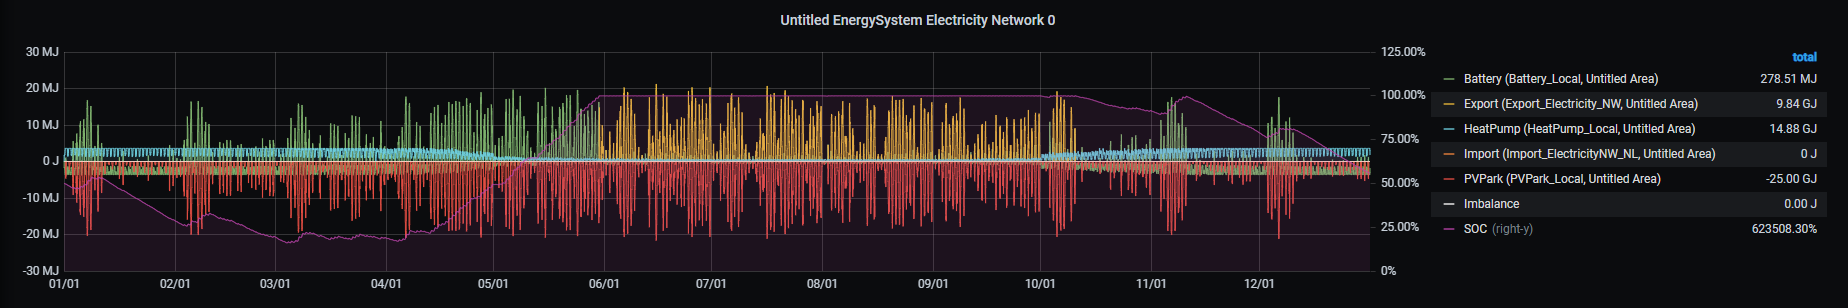
Figure 51: ESSIM simulation results
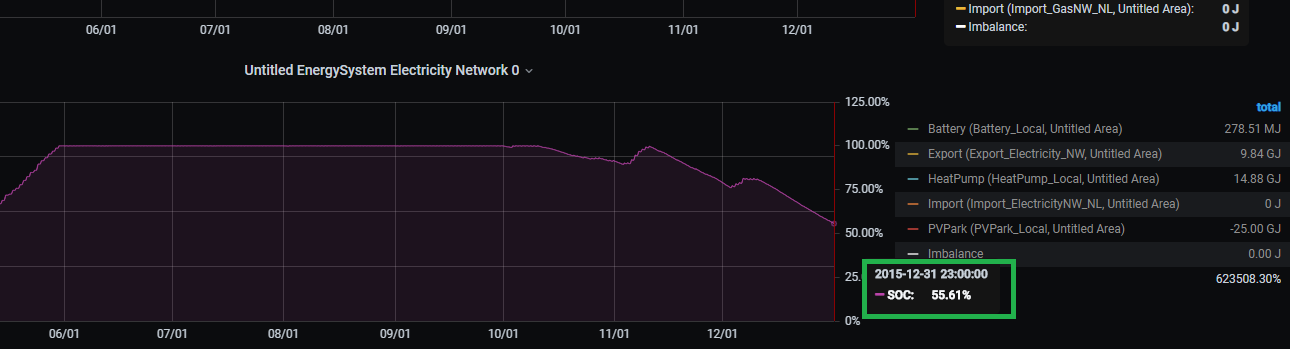
Figure 52: Battery State of Charge
Saving the model
To save the model, follow the steps from Tutorial 1: Basic Energy System, Saving the model. Name the model ‘Tutorial4_Scenario.esdl’.
Tutorial 5: H2 to store excess electricity production
Description
This tutorial guides you through the last and the most complex energy scenario. The scenario demonstrates how excess electricity production from local energy sources is converted t hydrogen (H2) and used in a hydrogen gas network.
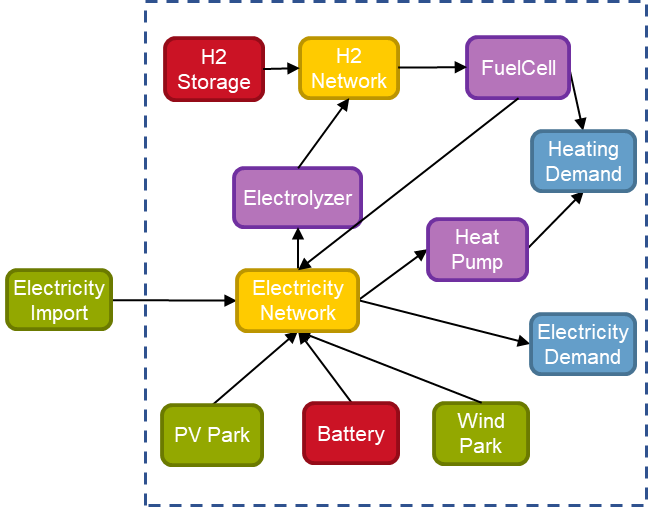
In this scenario, a WindPark is added as an additional local electricity producer and connected to the ElectricityNetwork. Electricity production is used to meet the local ElectricityDemand and the demand of the HeatPump that partially meets the HeatingDemand. Excess electricity production is stored in the Battery storage and converted to hydrogen via an Electrolyzer. Hydrogen is used by a FuelCell to convert it back to electricity and to heat that meets the rest of the HeatingDemand (not met by the HeatPump). Hydrogen that is not used by the FuelCell is stored in hydrogen storage.
Load the model
To build on the previously created EnergySystem, load the ‘Tutorial4_Scenario.esdl’ file from Tutorial 2: Not so basic Energy System. To load the model, follow the steps from Tutorial 2: Not so basic Energy System, Loading the base configuration.
Creating and Configuring an EnergySystem
In this scenario, the GasHeater and gas Import are no longer used as heating sources. Therefore, they have to be deleted. To delete these EnergyAssets, follow the next steps:
On the left-hand menu, select the bin icon (see Figure 53) (1)
Click on the icons of EnergyAssets to remove. Once selected, icons will be removed
Select gas Import EnergyAsset (2)
Select GasHeater EnergyAsset (3)
Select Export EnergyAsset (4)
Click on *Save* next to the bin icon to confirm changes (5)
Refresh the browser to show changes
Gas Import and GasHeater are now removed.
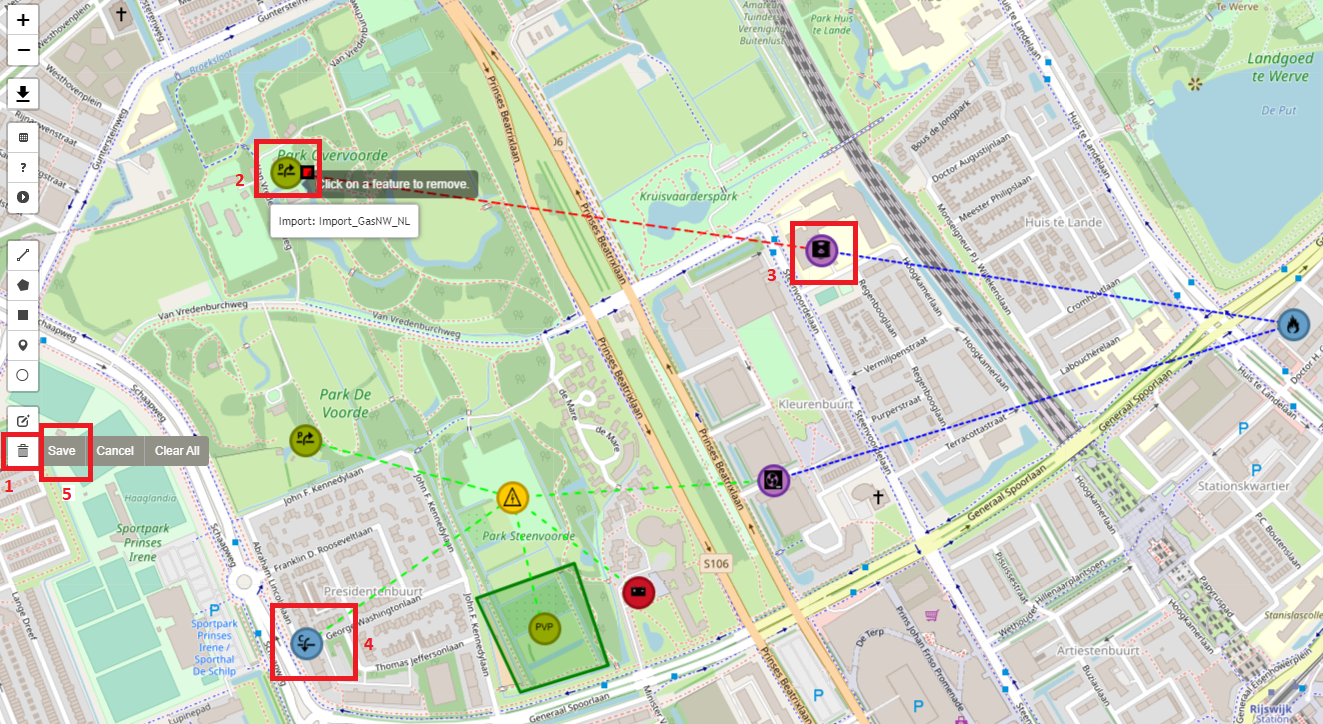
Figure 53: Removing EnergyAssets
Next, a number of assets have to be added to configure the system for this scenario:
Create and configure an ElectricityDemand EnergyAsset. As ElectricityDemand is created and configured in a similar way to HeatingDemand, refer to Tutorial 1: Basic Energy System, Creating an EnergySystem for a reference.
Name: ElectricityDemand_Local
Set profile of InPort
Profile class: Electricity households (E1A)
Multiplier and Quantity and Unit: 10 GJ
Create and configure a WindPark EnergyAsset. As WindPark is created in a similar way to a PVPark, refer to Tutorial 3: Renewable source export excess, Creating and Configuring the ElectricityNetwork, PVPark and Export.
Name: WindPark_Local
Set profile of OutPort
Profile class: Wind op land
Multiplier and Quantity and Unit: 100 GJ
Connect the EnergyAssets
InPort of ElectricityDemand to OutPort of ElectricityNetwork
OutPort of WindPark to InPort of ElectricityNetwork
Re-assign electricity Commodity to ElectricityNetwork
Refresh the browser to see the changes
The ElectricityNetwork is now configured and looks as in Figure 54.
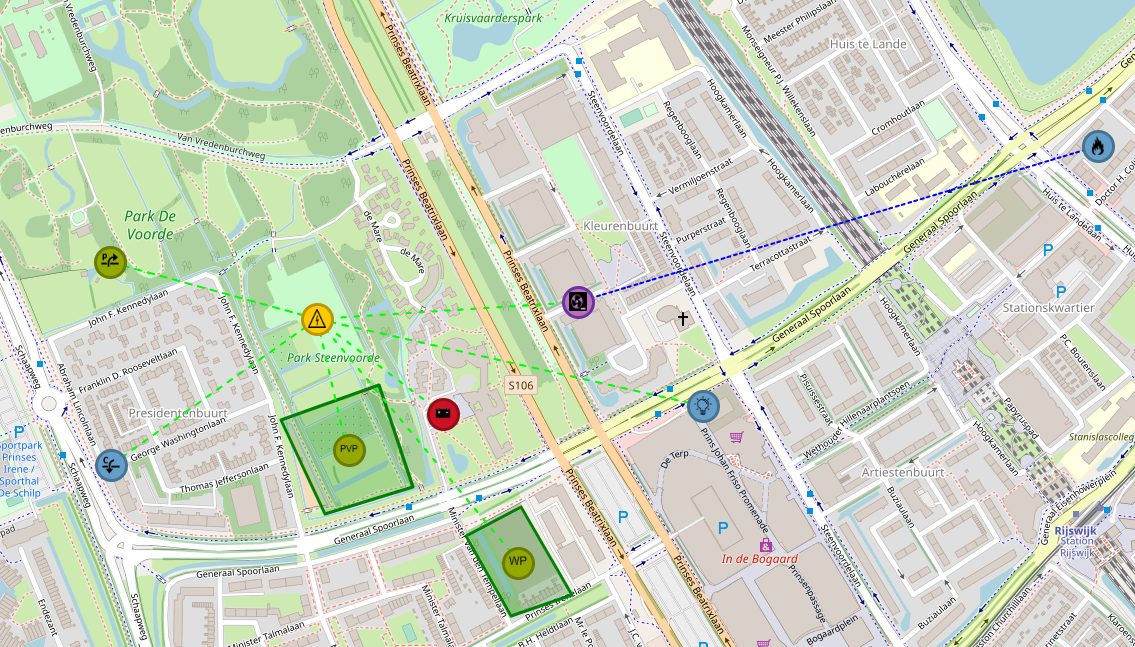
Figure 54: ElectricityNetwork with an ElectricityDemand and a WindPark
Next, we will create and configure the hydrogen network and its EnergyAssets. As MapEditor does not offer an H2Network asset, we can use the GasNetwork EnergyAsset to model a hydrogen network, and assign it a hydrogen energy Carrier. To create a hydrogen network, follow the next steps:
Create a GasNetwork EnergyAsset. As GasNetwork is created and configured in a similar way to an ElectricityNetwork, refer to Tutorial 3: Renewable source export excess, Creating and Configuring the ElectricityNetwork, PVPark and Export for a reference. In the remainder of this tutorial, this network is going to be referred to as HydrogenNetwork.
Name: Hydrogen Network
Create a hydrogen energy Carrier. Refer to Tutorial 1: Basic Energy System, Creating an EnergySystem on how to add an energy Carrier.
Carrier type: Energy carrier
Name: Hydrogen
Energy content: 120000000 MJ/kg
State of matter: Gaseous
Renewable type: Renewable
Assign hydrogen energy Carrier to HydrogenNetwork
An Electrolyzer EnergyAsset converts excess electricity from the ElectricityNetwork to hydrogen. Therefore:
Create and configure an Electrolyzer EnergyAsset (under Conversions)
Name: Electrolyzer_Local
Efficiency: 0.55
Power: 500000 W
Set DrivenBySupply strategy
Connect Electrolyzer EnergyAsset to HydrogenNetwork
InPort of Electrolyzer to OutPort of ElectricityNetwork
OutPort of Electrolyzer to InPort of HydrogenNetwork
Re-assign Carriers and Commodities
Re-assign electricity Commodity to ElectricityNetwork
Re-assign hydrogen Carrier to HydrogenNetwork
Refresh the browser to see the changes
The newly configured EnergySystem should look like Figure 55.
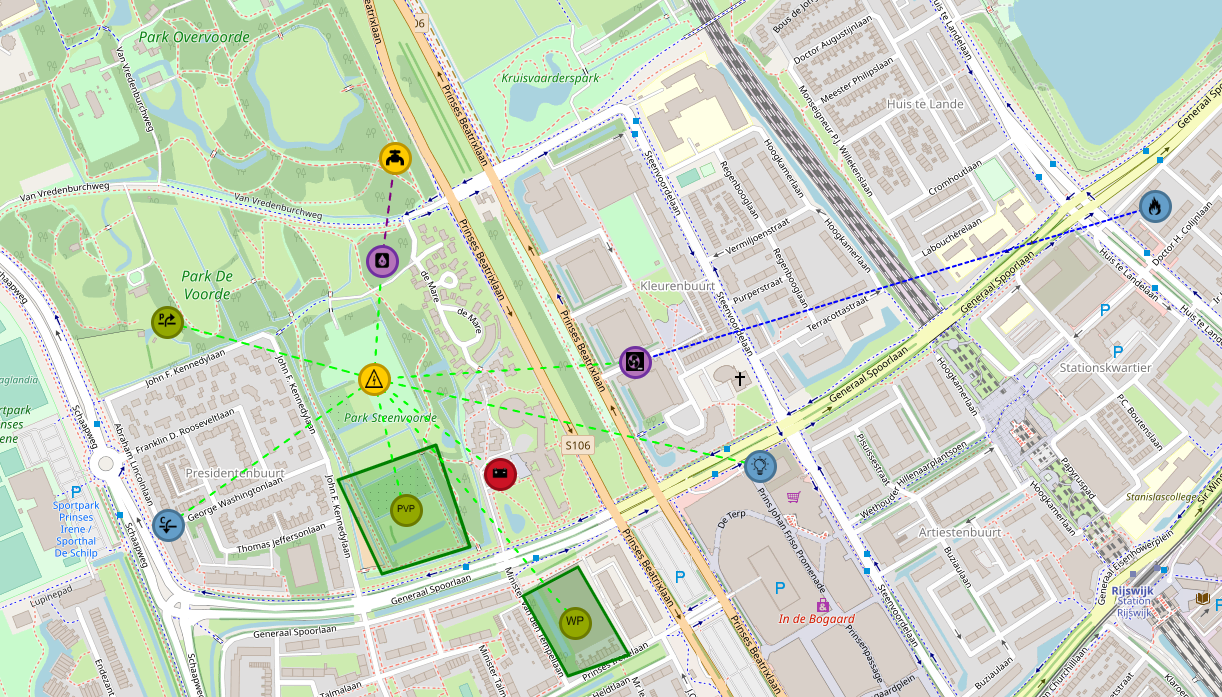
Figure 55: EnergySystem with a HydrogenNetwork and an Electrolyzer
In this scenario, hydrogen produced by the Electrolyzer is used in two ways. Hydrogen is first supplied to a FuelCell that converts it back to both electricity and heat. Produced heat is used to meet the rest of the HeatingDemand (not met by the HeatPump), whereas electricity is fed back into the ElectricityNetwork. Then, if there is excess hydrogen, it is stored in hydrogen Storage. To model this scenario, follow the next steps:
Create and configure a FuelCell EnergyAsset (under Conversions)
Name: FuelCell_Local
Efficiency: 0.9
Electrical Efficiency: 0.4
Fuel Type: Hydrogen
Heat Efficiency: 0.6
Lead Commodity: Heat
Power: 500000 W
Connect the FuelCell to HeatingDemand, HydrogenNetwork and ElectricityNetwork. As it produces both electricity and heat, FuelCell has two OutPorts, namely E Out (electricity) and H Out (heat).
InPort of the FuelCell to OutPort of HydrogenNetwork
H Out OutPort of the FuelCell to InPort of the HeatingDemand
E Out OutPort of the FuelCell to InPort of the ElectricityNetwork
Set DrivenByDemand for H Out strategy
Re-assign Carriers and Commodities
Re-assign electricity Commodity to ElectricityNetwork
Re-assign hydrogen Carrier to HydrogenNetwork
Refresh the browser to see the changes
The newly configured EnergySystem can be seen in Figure 56.
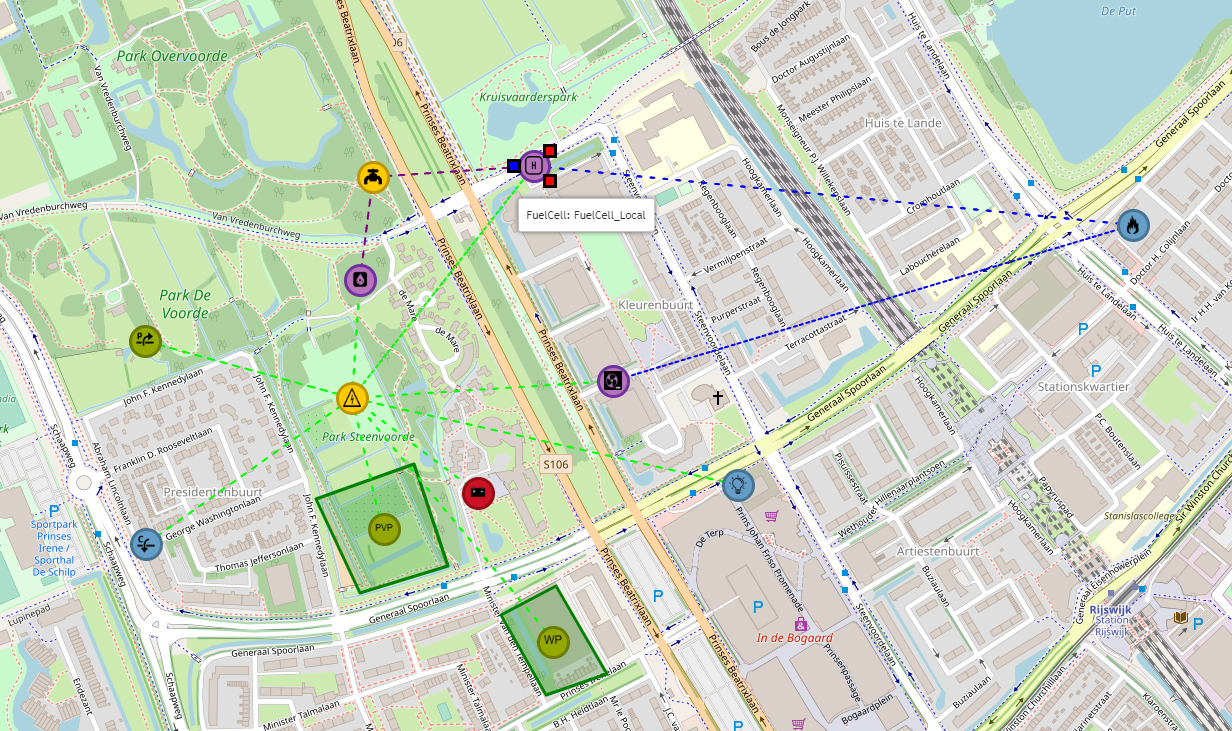
Figure 56: HydrogenNetwork with a FuelCell
Running an ESSIM simulation and interpreting the results
Before creating and configuring a hydrogen Storage to store excess hydrogen, first run an ESSIM simulation to see network balances in the newly created EnergySystem. This shows the current state of the system, and helps properly dimensioning hydrogen Storage. To run an ESSIM simulation, follow the instructions from Tutorial 1: Basic Energy System, Running an ESSIM simulation.
As seen in Figure 57, HydrogenNetwork is in imbalance, whereas Heat and ElectricityNetwork are balanced.
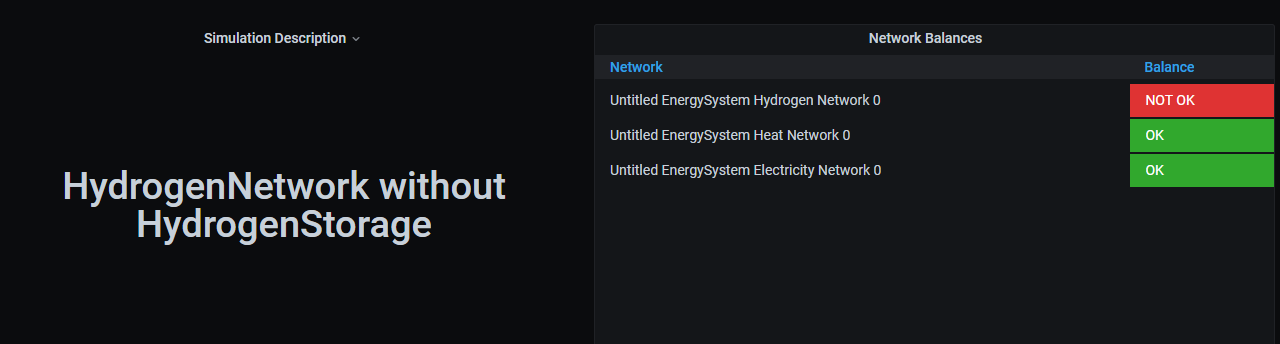
Figure 57: Network balances without HydrogenStorage
The details can be better observed by looking at individual panels for these networks. Figure 58 shows balance of Heat and Electricity, while Figure 59 shows an imbalance of 57.51 GJ in hydrogen network. A positive imbalance indicates overproduction in the system; therefore, hydrogen Storage is needed to store this excess hydrogen.
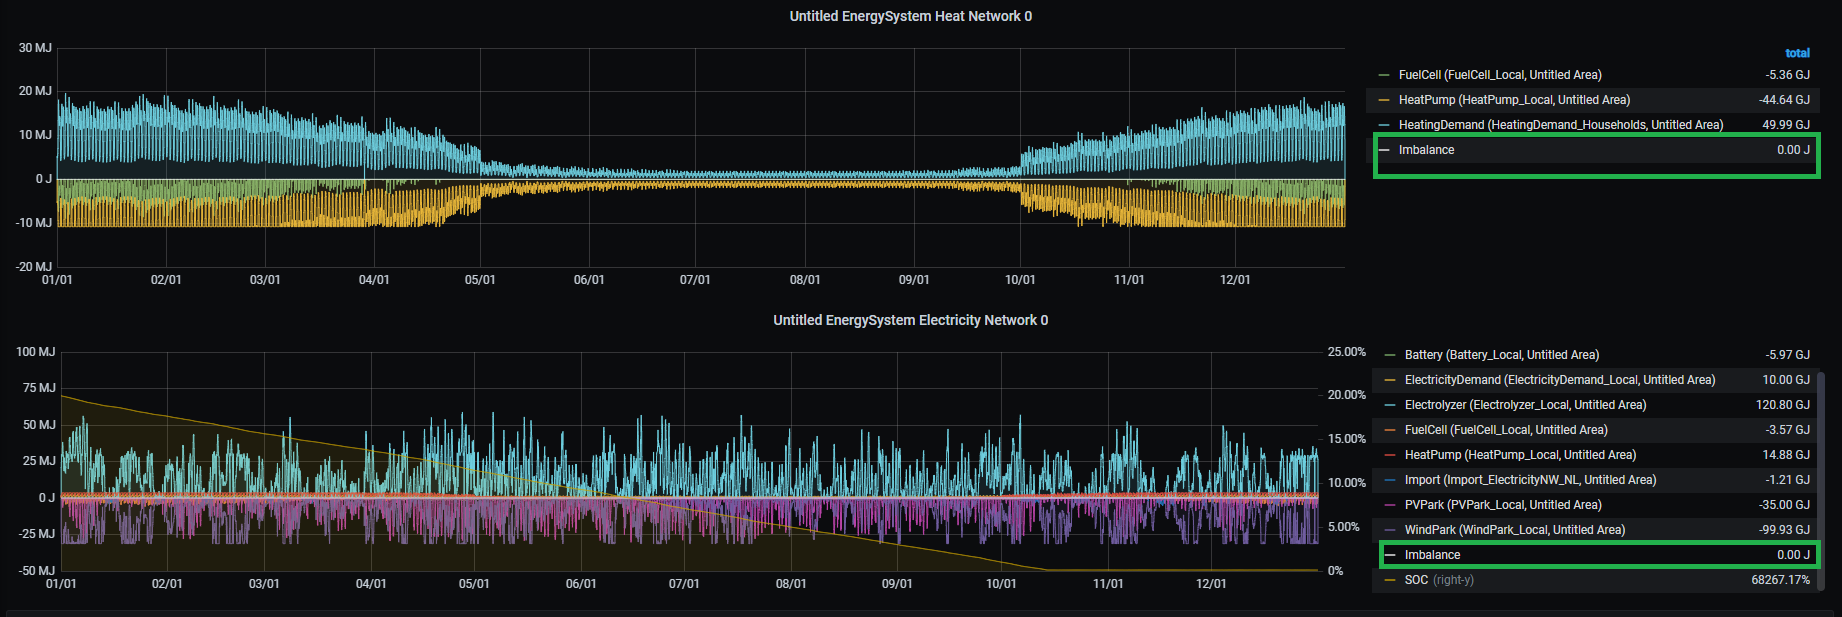
Figure 58: Heat and ElectricityNetwork balances
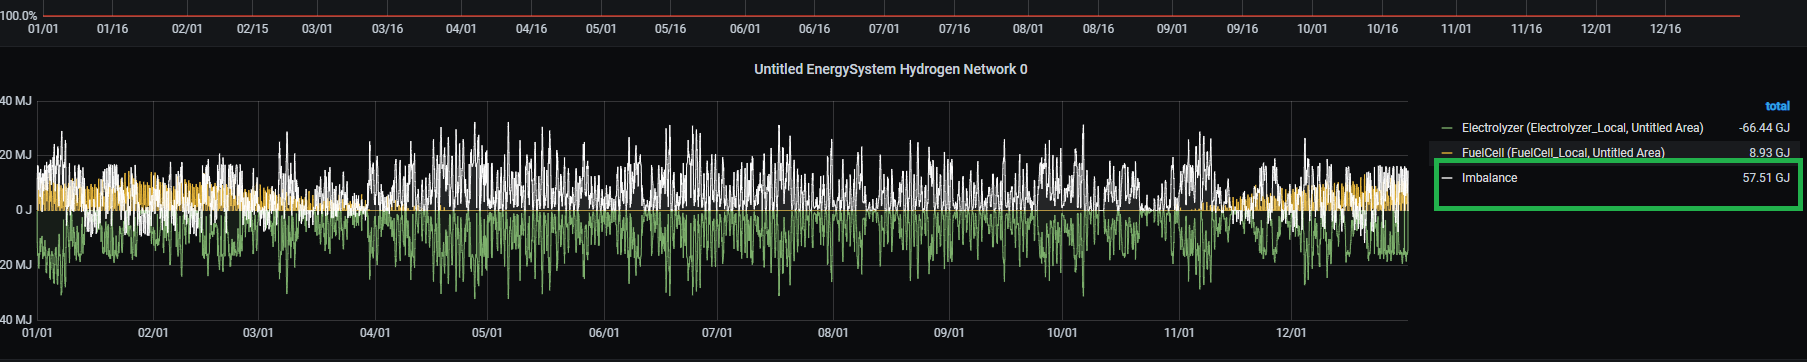
Figure 59: HydrogenNetwork imbalance
As hydrogen is a gas, hydrogen storage is modelled as a GasStorage EnergyAsset. Follow the next steps:
Create and configure hydrogen GasStorage EnergyAsset (under Storages). In the remainder of this tutorial, this Asset will be referred to as HydrogenStorage.
Name: HydrogenStorage_Local
Capacity: 60000000000 J
Max Charge Rate: 10000 W (10 kW to account for the highest peak in imbalance)
Max Discharge Rate: 10000 W
Connect the HydrogenStorage to the HydrogenNetwork
InPort of HydrogenStorage to OutPort of the HydrogenNetwork
Re-assign hydrogen Carrier to HydrogenNetwork
Refresh the browser to see the changes
Running an ESSIM simulation with newly created HydrogenStorage shows no more imbalance in hydrogen network (see Figure 60). Figure 61 shows that excess hydrogen is now stored in HydrogenStorage.
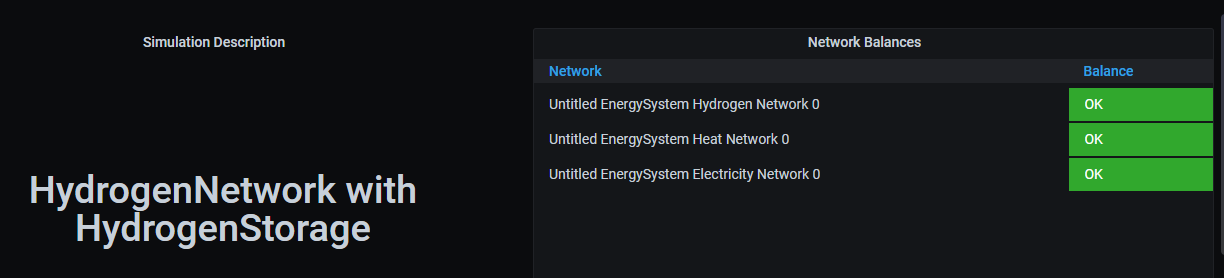
Figure 60: Network balances with HydrogenStorage
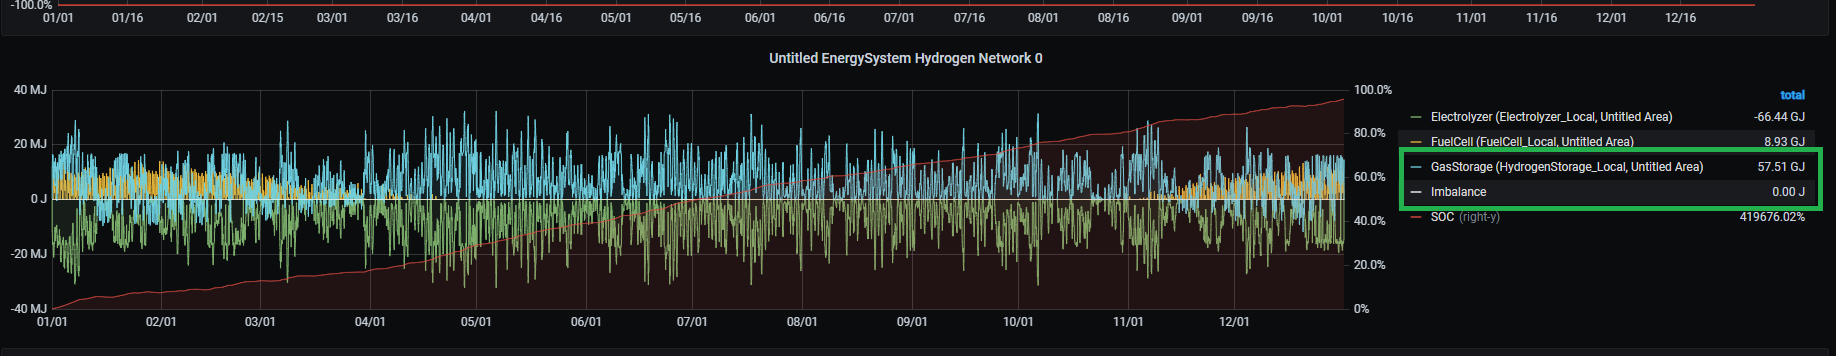
Figure 61: HydrogenNetwork balance with HydrogenStorage
Saving the model
To save the model, follow the steps from Tutorial 1: Basic Energy System, Saving the model. Name the model ‘Tutorial5_Scenario.esdl’.